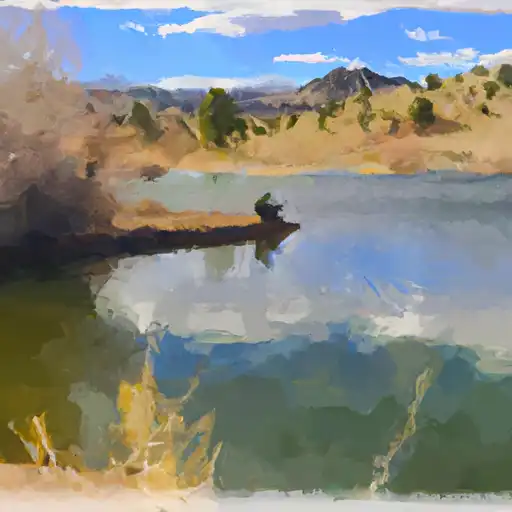
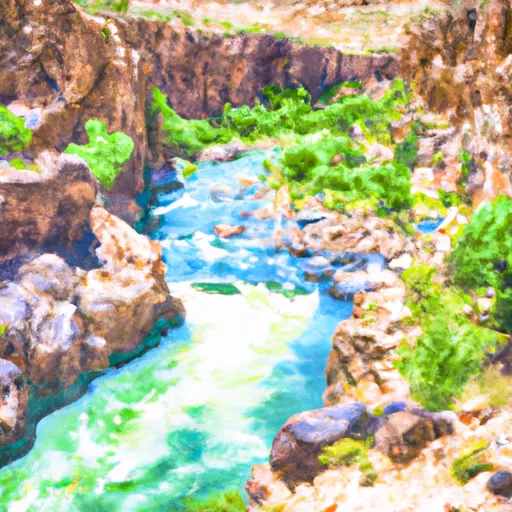
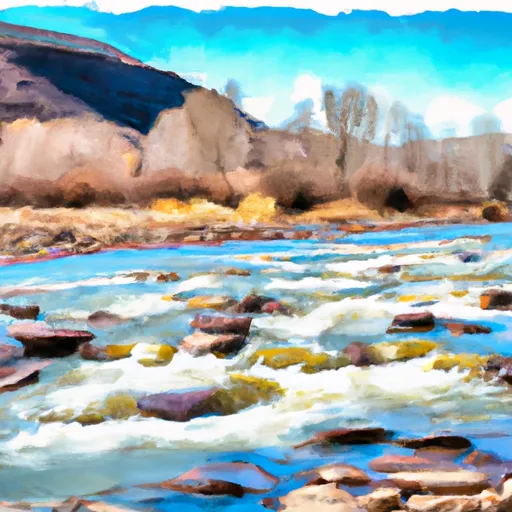
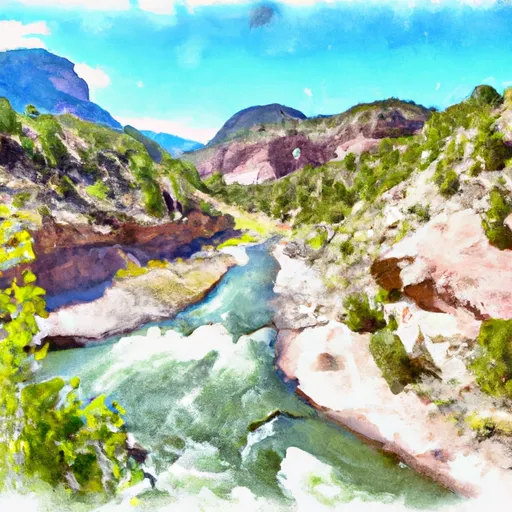
Redlands dam

Redlands
Located in Mesa County, Colorado, the Redlands Dam stands as a testament to early 20th-century engineering, completed in 1917 for the primary purpose of irrigation. This concrete gravity dam on the Gunnison River serves both hydroelectric and irrigation needs, with a storage capacity of 260 acre-feet and a spillway width of 312 feet. The dam boasts a low hazard potential and a very high risk assessment rating, indicating its critical importance in water resource management and climate resilience efforts.
Managed by private owners and regulated by the state, the Redlands Dam is subject to periodic inspections by the Federal Energy Regulatory Commission to ensure its structural integrity and operational safety. Despite its age, the dam has not undergone recent modifications and its condition assessment is not currently available. With a maximum discharge capacity of 500 cfs and a surface area of 40 acres, the dam plays a crucial role in water storage and distribution in the Grand Junction area.
As climate change threatens water resources across the region, the Redlands Dam stands as a vital asset in mitigating risks and ensuring sustainable water management practices. With its historical significance, functional design, and strategic location on the Gunnison River, the dam exemplifies the intersection of human ingenuity and environmental stewardship in the face of evolving climate challenges.
Plan around the weather
Same NOAA / yr.no feed Snoflo's iOS app uses. Watch the precipitation column on the meteogram -- rain on the basin upstream typically lifts inflow 24-72 hours later.
Next 5 days, hour by hour
Temperature line with weather symbols on top, snow + rain accumulation as columns, humidity as a dotted line.
5-day forecast table
Every 3 hours, broken out across temperature, snow, rain, humidity, and wind. Each cell is colour-coded relative to the column min/max.
| Time | Condition | Temp (°F) | Snow (in) | Rain (in) | Humidity (%) | Wind (mps) | Wind dir |
|---|---|---|---|---|---|---|---|
| Loading detailed forecast… | |||||||
15-day temperature & precipitation
Daily temperatures, snow, and rain projected over the next two weeks.
Nearby streamflow gauges
USGS streamgauges around Redlands -- inflows here typically show up in storage 24-72 hours later.
| Streamgauge | Discharge | View |
|---|---|---|
| Gunnison River Near Grand Junction | 719 cfs | → |
| Colo River Blw Grd Valley Div Nr Palisade Co | 255 cfs | → |
| Plateau Creek Near Cameo | 14 cfs | → |
| Colorado River Near Cameo | 1,770 cfs | → |
| Colorado River Near Colorado-Utah State Line | 1,690 cfs | → |
| Gunnison River At Delta | 554 cfs | → |


About Redlands
Where does the data for Redlands come from?
Structural and regulatory data come from the U.S. Army Corps of Engineers' National Inventory of Dams (NID). Weather forecast comes from NOAA / yr.no -- the same feed Snoflo's iOS app uses.
How often is the report updated?
NID structural data refreshes annually as the Corps publishes updated assessments. The weather forecast refreshes throughout the day.
What does the Low hazard rating mean?
The Corps of Engineers' hazard potential classification grades probable consequences if the dam fails: High = probable loss of human life; Significant = no probable loss of human life but possible economic loss / environmental damage; Low = no probable loss of human life, only minor economic / environmental losses. See the Dam Data Reference card below for the full definitions.
What's "% of normal"?
The current storage value compared to the historical average storage on this calendar day. 100% = right on average; values above 100% mean above-normal storage (wet year); values below mean below-normal (dry year or drought).
Can I get alerts when storage crosses a threshold?
Yes -- alerts are managed in the Snoflo iOS app. Favorite this dam, set a threshold, and you'll get a push the moment conditions cross.
Dam data reference
Condition Assessment
- Satisfactory
- No existing or potential dam safety deficiencies are recognized. Acceptable performance is expected under all loading conditions (static, hydrologic, seismic) in accordance with the minimum applicable state or federal regulatory criteria or tolerable risk guidelines.
- Fair
- No existing dam safety deficiencies are recognized for normal operating conditions. Rare or extreme hydrologic and/or seismic events may result in a dam safety deficiency. Risk may be in the range to take further action.
- Poor
- A dam safety deficiency is recognized for normal operating conditions which may realistically occur. Remedial action is necessary. POOR may also be used when uncertainties exist as to critical analysis parameters which identify a potential dam safety deficiency.
- Unsatisfactory
- A dam safety deficiency is recognized that requires immediate or emergency remedial action for problem resolution.
- Not Rated
- The dam has not been inspected, is not under state or federal jurisdiction, or has been inspected but, for whatever reason, has not been rated.
Hazard Potential Classification
- High
- Dams assigned the high hazard potential classification are those where failure or mis-operation will probably cause loss of human life.
- Significant
- Dams assigned the significant hazard potential classification are those dams where failure or mis-operation results in no probable loss of human life but can cause economic loss, environmental damage, disruption of lifeline facilities, or impact other concerns. Significant hazard potential classification dams are often located in predominantly rural or agricultural areas but could be in areas with population and significant infrastructure.
- Low
- Dams assigned the low hazard potential classification are those where failure or mis-operation results in no probable loss of human life and low economic and/or environmental losses. Losses are principally limited to the owner's property.
- Undetermined
- Dams for which a downstream hazard potential has not been designated or is not provided.