Taylor Park Reservoir At Taylor Park Reservoir Water Level
The operating agency’s most recent report for Taylor Park Reservoir At Taylor Park Reservoir is from May 21, 2026: a pool elevation of 9,308.6 ft and 67,660 acre-ft in storage. Newer readings will appear here as soon as they are published.

Taylor Park Reservoir At Taylor Park
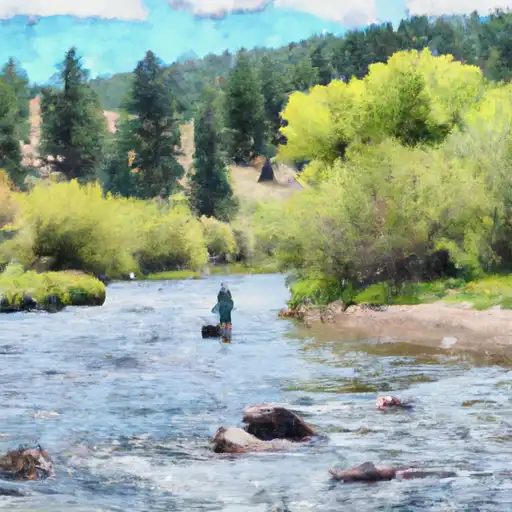
Taylor Park Reservoir is a popular recreational site located in Taylor Park, Colorado. It was created in 1937 with the construction of the Taylor Park Dam on the Taylor River. The reservoir has a capacity of 106,230 acre-feet and serves as a source of water for hydroelectric power generation and irrigation for the surrounding agricultural lands. The area receives an average of 250 inches of snowfall annually, which is a vital source of water for the reservoir. The snowmelt from the surrounding mountain ranges feeds the Taylor River, which flows into the reservoir. The reservoir is a popular fishing spot, with rainbow, brown, and lake trout being the most common species. Additionally, the reservoir offers various recreational activities such as camping, hiking, boating, and hunting.
Daily levels at Taylor Park Reservoir At Taylor Park
Storage volume, pool elevation, and total release plotted from the operating agency's daily observations.
Reservoir storage, acre-ft
ac-ft · code 00054
Lake or reservoir water surface elevation above NAVD 1988, ft
ft · code 62615
Inside the reservoir
The real shoreline of this water body, with a depth model scaled so the basin holds exactly its recorded storage. Drag to orbit, scroll to zoom, and use the slider to drain and refill it. Click anywhere on the basin for the modelled depth there.
How this is built. The shoreline is the National Hydrography
Dataset polygon for this water body (“Taylor Park Reservoir”),
matched to the dam by proximity and confirmed by comparing its area with the
National Inventory of Dams surface area.
Depth is modelled, not surveyed: the basin is shaped by distance from
shore — deep in open water, shallow in the bays — and scaled so its
volume equals the recorded storage. No national bathymetric survey exists for
US reservoirs. Treat the shoreline, area and volume as measured, and the depth
distribution as an informed approximation.
Above normal pool, water is shown rising within the normal-pool
shoreline. Where it would actually spread depends on the surrounding
terrain, which is not modelled here — a reservoir in a steep canyon barely
widens, one on flat ground can spread a long way. This is a depth and volume
figure, not an inundation map. Official inundation mapping for a dam
comes from its Emergency Action Plan.
Plan around the weather
Same NOAA / yr.no feed Snoflo's iOS app uses. Watch the precipitation column on the meteogram -- rain on the basin upstream typically lifts inflow 24-72 hours later.
Next 5 days, hour by hour
Temperature line with weather symbols on top, snow + rain accumulation as columns, humidity as a dotted line.
5-day forecast table
Every 3 hours, broken out across temperature, snow, rain, humidity, and wind. Each cell is colour-coded relative to the column min/max.
| Time | Condition | Temp (°F) | Snow (in) | Rain (in) | Humidity (%) | Wind (mps) | Wind dir |
|---|---|---|---|---|---|---|---|
| Loading detailed forecast… | |||||||
15-day temperature & precipitation
Daily temperatures, snow, and rain projected over the next two weeks.
Nearby streamflow gauges
USGS streamgauges around Taylor Park Reservoir At Taylor Park -- inflows here typically show up in storage 24-72 hours later.
| Streamgauge | Discharge | View |
|---|---|---|
| Taylor River Below Taylor Park Reservoir | 54 cfs | → |
| Taylor River At Taylor Park | 40 cfs | → |
| East River Bl Cement Creek Nr Crested Butte | 67 cfs | → |
| Taylor River At Almont | 101 cfs | → |
| East River At Almont Co. | 47 cfs | → |
| Lincoln Creek Bl Grizzly Reservoir | 14 cfs | → |









About Taylor Park Reservoir At Taylor Park
What is the water level at Taylor Park Reservoir At Taylor Park Reservoir right now?
The most recent report for Taylor Park Reservoir At Taylor Park Reservoir is from May 21, 2026; no newer reading has been published. Daily levels and the year-over-year trend are shown on this page.
Is Taylor Park Reservoir At Taylor Park Reservoir high or low right now?
Compare the percent-of-normal figure on this page: above 100% means storage is higher than the historical average for the date (a wet year), below 100% means lower (a dry year or drought). The daily-levels chart shows the current trend.
Where does the data for Taylor Park Reservoir At Taylor Park come from?
Daily storage, pool elevation, and release rates are sourced from USGS, USBR, and USACE monitoring stations. Weather forecast comes from NOAA / yr.no -- the same feed Snoflo's iOS app uses.
How often is the report updated?
Storage observations are updated daily by the operating agency. The 15-day weather forecast refreshes throughout the day. Snoflo caches and renders the most recent observation -- check the "as of" timestamp on the storage card.
What does the Hazard hazard rating mean?
The Corps of Engineers' hazard potential classification grades probable consequences if the dam fails: High = probable loss of human life; Significant = no probable loss of human life but possible economic loss / environmental damage; Low = no probable loss of human life, only minor economic / environmental losses. See the Dam Data Reference card below for the full definitions.
What's "% of normal"?
The current storage value compared to the historical average storage on this calendar day. 100% = right on average; values above 100% mean above-normal storage (wet year); values below mean below-normal (dry year or drought).
Can I get alerts when storage crosses a threshold?
Yes -- alerts are managed in the Snoflo iOS app. Favorite this reservoir, set a threshold, and you'll get a push the moment conditions cross.