Ward Lake Dam Dam

Ward Lake Dam
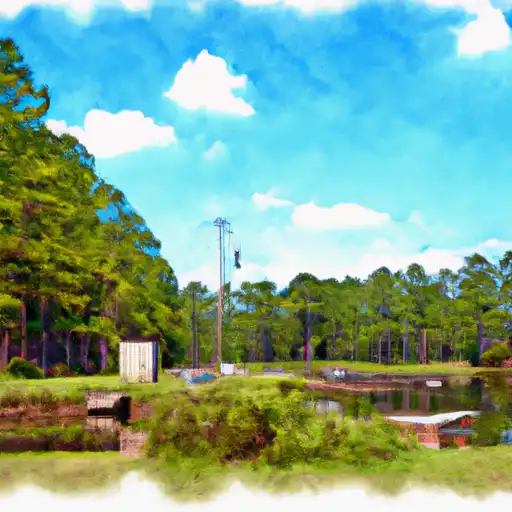
Ward Lake Dam in Ashburn, Georgia is a private earth dam with a primary purpose that remains unspecified. The dam stands at a height of 15.5 feet and has a hydraulic height of 13.4 feet, with a total length of 475 feet. It has a storage capacity of 124 acre-feet, with a normal storage level of 92 acre-feet. The dam is classified as having a low hazard potential and a moderate risk assessment.
Despite being a private structure, Ward Lake Dam is subject to state jurisdiction and inspection. The last inspection took place in July 2015, with a frequency of every five years. The dam features uncontrolled spillways and outlet gates, with no associated locks. While the dam is not regulated by a state agency or permitted, it is maintained to meet state inspection standards. Although the dam's condition is not currently rated, it is considered to have a moderate risk level.
Located in Turner County, Georgia, Ward Lake Dam offers a critical water resource for the surrounding area. With its moderate risk assessment and low hazard potential, the dam plays a vital role in water storage and management. Enthusiasts interested in water resources and climate will find Ward Lake Dam to be an intriguing structure worth monitoring for its ongoing maintenance and risk management measures.
Plan around the weather
Same NOAA / yr.no feed Snoflo's iOS app uses. Watch the precipitation column on the meteogram -- rain on the basin upstream typically lifts inflow 24-72 hours later.
Next 5 days, hour by hour
Temperature line with weather symbols on top, snow + rain accumulation as columns, humidity as a dotted line.
5-day forecast table
Every 3 hours, broken out across temperature, snow, rain, humidity, and wind. Each cell is colour-coded relative to the column min/max.
| Time | Condition | Temp (°F) | Snow (in) | Rain (in) | Humidity (%) | Wind (mps) | Wind dir |
|---|---|---|---|---|---|---|---|
| Loading detailed forecast… | |||||||
15-day temperature & precipitation
Daily temperatures, snow, and rain projected over the next two weeks.
Nearby streamflow gauges
USGS streamgauges around Ward Lake Dam -- inflows here typically show up in storage 24-72 hours later.
| Streamgauge | Discharge | View |
|---|---|---|
| Little R At Tifton Worth Co Line Rd | 1 cfs | → |
| Flint River At Ga 32 | 1,760 cfs | → |
| Muckalee Creek At Ga 195 | 135 cfs | → |
| Flint River At Albany | 3,620 cfs | → |
| Kinchafoonee Creek Near Dawson | 301 cfs | → |
| Turkey Creek At Byromville | 19 cfs | → |


About Ward Lake Dam
Where does the data for Ward Lake Dam come from?
Structural and regulatory data come from the U.S. Army Corps of Engineers' National Inventory of Dams (NID). Weather forecast comes from NOAA / yr.no -- the same feed Snoflo's iOS app uses.
How often is the report updated?
NID structural data refreshes annually as the Corps publishes updated assessments. The weather forecast refreshes throughout the day.
What does the Low hazard rating mean?
The Corps of Engineers' hazard potential classification grades probable consequences if the dam fails: High = probable loss of human life; Significant = no probable loss of human life but possible economic loss / environmental damage; Low = no probable loss of human life, only minor economic / environmental losses. See the Dam Data Reference card below for the full definitions.
What's "% of normal"?
The current storage value compared to the historical average storage on this calendar day. 100% = right on average; values above 100% mean above-normal storage (wet year); values below mean below-normal (dry year or drought).
Can I get alerts when storage crosses a threshold?
Yes -- alerts are managed in the Snoflo iOS app. Favorite this dam, set a threshold, and you'll get a push the moment conditions cross.
Dam data reference
Condition Assessment
- Satisfactory
- No existing or potential dam safety deficiencies are recognized. Acceptable performance is expected under all loading conditions (static, hydrologic, seismic) in accordance with the minimum applicable state or federal regulatory criteria or tolerable risk guidelines.
- Fair
- No existing dam safety deficiencies are recognized for normal operating conditions. Rare or extreme hydrologic and/or seismic events may result in a dam safety deficiency. Risk may be in the range to take further action.
- Poor
- A dam safety deficiency is recognized for normal operating conditions which may realistically occur. Remedial action is necessary. POOR may also be used when uncertainties exist as to critical analysis parameters which identify a potential dam safety deficiency.
- Unsatisfactory
- A dam safety deficiency is recognized that requires immediate or emergency remedial action for problem resolution.
- Not Rated
- The dam has not been inspected, is not under state or federal jurisdiction, or has been inspected but, for whatever reason, has not been rated.
Hazard Potential Classification
- High
- Dams assigned the high hazard potential classification are those where failure or mis-operation will probably cause loss of human life.
- Significant
- Dams assigned the significant hazard potential classification are those dams where failure or mis-operation results in no probable loss of human life but can cause economic loss, environmental damage, disruption of lifeline facilities, or impact other concerns. Significant hazard potential classification dams are often located in predominantly rural or agricultural areas but could be in areas with population and significant infrastructure.
- Low
- Dams assigned the low hazard potential classification are those where failure or mis-operation results in no probable loss of human life and low economic and/or environmental losses. Losses are principally limited to the owner's property.
- Undetermined
- Dams for which a downstream hazard potential has not been designated or is not provided.