Lake Rutledge Dam Dam

Lake Rutledge Dam
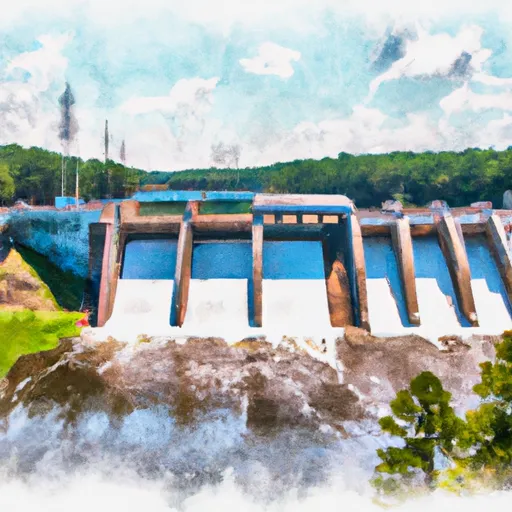
Located in Rutledge, Georgia, Lake Rutledge Dam was completed in 1940 by the Civilian Conservation Corps (CCC) and serves as a key recreational area for water resource and climate enthusiasts. The dam stands at 30 feet in height, with a length of 532 feet, and has a storage capacity of 7,366 acre-feet. The dam is situated on Hard Labor Creek in Morgan County, Georgia, providing a surface area of 275 acres for outdoor activities such as fishing, boating, and swimming.
Despite being classified as having a low hazard potential, Lake Rutledge Dam has a moderate risk assessment rating. The dam is currently not rated for condition assessment, with the last inspection conducted in July 1997. While the dam is not regulated by the state, it does undergo regular inspections. In the event of an emergency, the dam does not have an Emergency Action Plan (EAP) prepared, highlighting the need for updated risk management measures and guidelines to ensure the safety of surrounding communities and the environment.
With its historical significance and recreational value, Lake Rutledge Dam is a focal point for outdoor enthusiasts in the Rutledge area. As a CCC-designed structure, the dam provides both a source of leisure and a reminder of the importance of maintaining and managing water resources in a sustainable and responsible manner. As efforts continue to assess and mitigate risks associated with the dam, it remains a vital component of the local ecosystem and a beloved destination for those seeking to enjoy the beauty of Georgia's natural landscapes.
Plan around the weather
Same NOAA / yr.no feed Snoflo's iOS app uses. Watch the precipitation column on the meteogram -- rain on the basin upstream typically lifts inflow 24-72 hours later.
Next 5 days, hour by hour
Temperature line with weather symbols on top, snow + rain accumulation as columns, humidity as a dotted line.
5-day forecast table
Every 3 hours, broken out across temperature, snow, rain, humidity, and wind. Each cell is colour-coded relative to the column min/max.
| Time | Condition | Temp (°F) | Snow (in) | Rain (in) | Humidity (%) | Wind (mps) | Wind dir |
|---|---|---|---|---|---|---|---|
| Loading detailed forecast… | |||||||
15-day temperature & precipitation
Daily temperatures, snow, and rain projected over the next two weeks.
Nearby streamflow gauges
USGS streamgauges around Lake Rutledge Dam -- inflows here typically show up in storage 24-72 hours later.
| Streamgauge | Discharge | View |
|---|---|---|
| Alcovy River Above Covington | 82 cfs | → |
| Apalachee River Near Bostwick | 70 cfs | → |
| Alcovy River Below Covington | 154 cfs | → |
| Oconee River Near Penfield | 324 cfs | → |
| Little Haynes Creek At Dial Mill Rd Nr Milstead Ga | 11 cfs | → |
| Big Haynes Creek At Bald Rock Road | 42 cfs | → |


About Lake Rutledge Dam
Where does the data for Lake Rutledge Dam come from?
Structural and regulatory data come from the U.S. Army Corps of Engineers' National Inventory of Dams (NID). Weather forecast comes from NOAA / yr.no -- the same feed Snoflo's iOS app uses.
How often is the report updated?
NID structural data refreshes annually as the Corps publishes updated assessments. The weather forecast refreshes throughout the day.
What does the Low hazard rating mean?
The Corps of Engineers' hazard potential classification grades probable consequences if the dam fails: High = probable loss of human life; Significant = no probable loss of human life but possible economic loss / environmental damage; Low = no probable loss of human life, only minor economic / environmental losses. See the Dam Data Reference card below for the full definitions.
What's "% of normal"?
The current storage value compared to the historical average storage on this calendar day. 100% = right on average; values above 100% mean above-normal storage (wet year); values below mean below-normal (dry year or drought).
Can I get alerts when storage crosses a threshold?
Yes -- alerts are managed in the Snoflo iOS app. Favorite this dam, set a threshold, and you'll get a push the moment conditions cross.
Dam data reference
Condition Assessment
- Satisfactory
- No existing or potential dam safety deficiencies are recognized. Acceptable performance is expected under all loading conditions (static, hydrologic, seismic) in accordance with the minimum applicable state or federal regulatory criteria or tolerable risk guidelines.
- Fair
- No existing dam safety deficiencies are recognized for normal operating conditions. Rare or extreme hydrologic and/or seismic events may result in a dam safety deficiency. Risk may be in the range to take further action.
- Poor
- A dam safety deficiency is recognized for normal operating conditions which may realistically occur. Remedial action is necessary. POOR may also be used when uncertainties exist as to critical analysis parameters which identify a potential dam safety deficiency.
- Unsatisfactory
- A dam safety deficiency is recognized that requires immediate or emergency remedial action for problem resolution.
- Not Rated
- The dam has not been inspected, is not under state or federal jurisdiction, or has been inspected but, for whatever reason, has not been rated.
Hazard Potential Classification
- High
- Dams assigned the high hazard potential classification are those where failure or mis-operation will probably cause loss of human life.
- Significant
- Dams assigned the significant hazard potential classification are those dams where failure or mis-operation results in no probable loss of human life but can cause economic loss, environmental damage, disruption of lifeline facilities, or impact other concerns. Significant hazard potential classification dams are often located in predominantly rural or agricultural areas but could be in areas with population and significant infrastructure.
- Low
- Dams assigned the low hazard potential classification are those where failure or mis-operation results in no probable loss of human life and low economic and/or environmental losses. Losses are principally limited to the owner's property.
- Undetermined
- Dams for which a downstream hazard potential has not been designated or is not provided.