Millers Millpond Dam Dam

Millers Millpond Dam
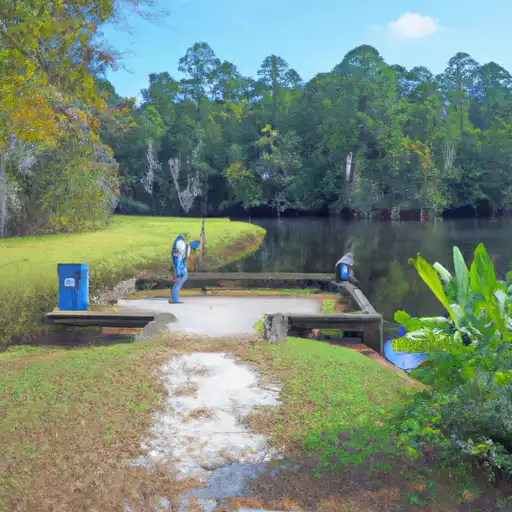
Millers Millpond Dam, located in Burke, Georgia, along the Boggy Gut Creek, is a privately owned Earth dam completed in 1931 by designer Miller Sr. With a height of 12 feet and a length of 410 feet, the dam serves as a vital structure for water resource management in the area. The dam has a normal storage capacity of 144 acre-feet and a maximum storage of 269 acre-feet, covering a surface area of 36 acres and draining an area of 19,000 acres.
Despite being unregulated by the state and classified as having a low hazard potential, Millers Millpond Dam is subject to regular inspections, with the last one conducted in June 2014. The dam's primary purpose is listed as "Other", with an uncontrolled spillway and outlet gates. The risk assessment for the dam is moderate (3), indicating a need for ongoing monitoring and potential risk management measures in place.
For water resource and climate enthusiasts, Millers Millpond Dam serves as an interesting case study in the management of aging infrastructure and the importance of regular inspection and maintenance of dams for ensuring public safety and environmental protection. The dam's location in the McKinney Church Environs highlights its significance in the local ecosystem and the potential impact of its operation on the surrounding area. With a rich history dating back to the early 20th century, Millers Millpond Dam stands as a testament to the engineering ingenuity of its time and the ongoing challenges of balancing water resource management with environmental conservation.
Plan around the weather
Same NOAA / yr.no feed Snoflo's iOS app uses. Watch the precipitation column on the meteogram -- rain on the basin upstream typically lifts inflow 24-72 hours later.
Next 5 days, hour by hour
Temperature line with weather symbols on top, snow + rain accumulation as columns, humidity as a dotted line.
5-day forecast table
Every 3 hours, broken out across temperature, snow, rain, humidity, and wind. Each cell is colour-coded relative to the column min/max.
| Time | Condition | Temp (°F) | Snow (in) | Rain (in) | Humidity (%) | Wind (mps) | Wind dir |
|---|---|---|---|---|---|---|---|
| Loading detailed forecast… | |||||||
15-day temperature & precipitation
Daily temperatures, snow, and rain projected over the next two weeks.
Nearby streamflow gauges
USGS streamgauges around Millers Millpond Dam -- inflows here typically show up in storage 24-72 hours later.
| Streamgauge | Discharge | View |
|---|---|---|
| Brier Creek Near Waynesboro | 281 cfs | → |
| Savannah River At Augusta | 4,140 cfs | → |
| Spirit Creek At Us 1 | 7 cfs | → |
| Beaverdam Creek Near Sardis | 3 cfs | → |
| Butler Creek Below 7th Avenue | 6 cfs | → |
| Brier Creek At Millhaven | 365 cfs | → |


About Millers Millpond Dam
Where does the data for Millers Millpond Dam come from?
Structural and regulatory data come from the U.S. Army Corps of Engineers' National Inventory of Dams (NID). Weather forecast comes from NOAA / yr.no -- the same feed Snoflo's iOS app uses.
How often is the report updated?
NID structural data refreshes annually as the Corps publishes updated assessments. The weather forecast refreshes throughout the day.
What does the Low hazard rating mean?
The Corps of Engineers' hazard potential classification grades probable consequences if the dam fails: High = probable loss of human life; Significant = no probable loss of human life but possible economic loss / environmental damage; Low = no probable loss of human life, only minor economic / environmental losses. See the Dam Data Reference card below for the full definitions.
What's "% of normal"?
The current storage value compared to the historical average storage on this calendar day. 100% = right on average; values above 100% mean above-normal storage (wet year); values below mean below-normal (dry year or drought).
Can I get alerts when storage crosses a threshold?
Yes -- alerts are managed in the Snoflo iOS app. Favorite this dam, set a threshold, and you'll get a push the moment conditions cross.
Dam data reference
Condition Assessment
- Satisfactory
- No existing or potential dam safety deficiencies are recognized. Acceptable performance is expected under all loading conditions (static, hydrologic, seismic) in accordance with the minimum applicable state or federal regulatory criteria or tolerable risk guidelines.
- Fair
- No existing dam safety deficiencies are recognized for normal operating conditions. Rare or extreme hydrologic and/or seismic events may result in a dam safety deficiency. Risk may be in the range to take further action.
- Poor
- A dam safety deficiency is recognized for normal operating conditions which may realistically occur. Remedial action is necessary. POOR may also be used when uncertainties exist as to critical analysis parameters which identify a potential dam safety deficiency.
- Unsatisfactory
- A dam safety deficiency is recognized that requires immediate or emergency remedial action for problem resolution.
- Not Rated
- The dam has not been inspected, is not under state or federal jurisdiction, or has been inspected but, for whatever reason, has not been rated.
Hazard Potential Classification
- High
- Dams assigned the high hazard potential classification are those where failure or mis-operation will probably cause loss of human life.
- Significant
- Dams assigned the significant hazard potential classification are those dams where failure or mis-operation results in no probable loss of human life but can cause economic loss, environmental damage, disruption of lifeline facilities, or impact other concerns. Significant hazard potential classification dams are often located in predominantly rural or agricultural areas but could be in areas with population and significant infrastructure.
- Low
- Dams assigned the low hazard potential classification are those where failure or mis-operation results in no probable loss of human life and low economic and/or environmental losses. Losses are principally limited to the owner's property.
- Undetermined
- Dams for which a downstream hazard potential has not been designated or is not provided.