Fenwick Lake Dam Dam

Fenwick Lake Dam
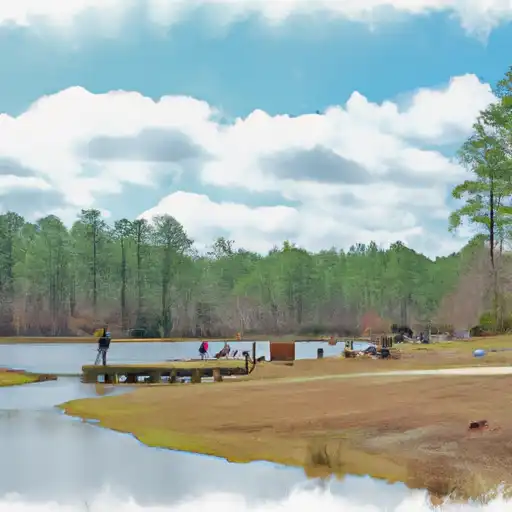
Fenwick Lake Dam, located in Sims Landing Environs, Georgia, is a private dam built in 1956 with a primary purpose of fire protection and as a stock or small fish pond. Designed by the Natural Resources Conservation Service, this earth dam stands at a height of 18 feet and stretches 550 feet in length. The dam has a storage capacity of 110 acre-feet, with a normal storage level of 70 acre-feet, covering a surface area of 10 acres.
Although the dam is categorized as low hazard potential and has not been rated for condition assessment, it undergoes inspections every 5 years, with the last recorded inspection dating back to December 1989. The dam is equipped with an uncontrolled spillway and outlet gates, designed to manage any excess water flow. With a moderate risk assessment rating, Fenwick Lake Dam remains a crucial structure for water resource management in the area, ensuring the safety of surrounding communities and wildlife.
As enthusiasts of water resources and climate, the Fenwick Lake Dam serves as a fascinating example of human intervention in managing water for various purposes. The dam's construction and design reflect the importance of balancing the needs of fire protection, livestock, and ecological sustainability. Despite its age, the dam continues to play a vital role in the local ecosystem, highlighting the ongoing efforts to maintain and regulate water resources in Georgia.
Plan around the weather
Same NOAA / yr.no feed Snoflo's iOS app uses. Watch the precipitation column on the meteogram -- rain on the basin upstream typically lifts inflow 24-72 hours later.
Next 5 days, hour by hour
Temperature line with weather symbols on top, snow + rain accumulation as columns, humidity as a dotted line.
5-day forecast table
Every 3 hours, broken out across temperature, snow, rain, humidity, and wind. Each cell is colour-coded relative to the column min/max.
| Time | Condition | Temp (°F) | Snow (in) | Rain (in) | Humidity (%) | Wind (mps) | Wind dir |
|---|---|---|---|---|---|---|---|
| Loading detailed forecast… | |||||||
15-day temperature & precipitation
Daily temperatures, snow, and rain projected over the next two weeks.
Nearby streamflow gauges
USGS streamgauges around Fenwick Lake Dam -- inflows here typically show up in storage 24-72 hours later.
| Streamgauge | Discharge | View |
|---|---|---|
| Brier Creek Near Waynesboro | 281 cfs | → |
| Beaverdam Creek Near Sardis | 3 cfs | → |
| Brier Creek At Millhaven | 365 cfs | → |
| Savannah R At Burtons Ferry Br Nr Millhaven | 5,440 cfs | → |
| Savannah River At Augusta | 4,140 cfs | → |
| Spirit Creek At Us 1 | 7 cfs | → |


About Fenwick Lake Dam
Where does the data for Fenwick Lake Dam come from?
Structural and regulatory data come from the U.S. Army Corps of Engineers' National Inventory of Dams (NID). Weather forecast comes from NOAA / yr.no -- the same feed Snoflo's iOS app uses.
How often is the report updated?
NID structural data refreshes annually as the Corps publishes updated assessments. The weather forecast refreshes throughout the day.
What does the Low hazard rating mean?
The Corps of Engineers' hazard potential classification grades probable consequences if the dam fails: High = probable loss of human life; Significant = no probable loss of human life but possible economic loss / environmental damage; Low = no probable loss of human life, only minor economic / environmental losses. See the Dam Data Reference card below for the full definitions.
What's "% of normal"?
The current storage value compared to the historical average storage on this calendar day. 100% = right on average; values above 100% mean above-normal storage (wet year); values below mean below-normal (dry year or drought).
Can I get alerts when storage crosses a threshold?
Yes -- alerts are managed in the Snoflo iOS app. Favorite this dam, set a threshold, and you'll get a push the moment conditions cross.
Dam data reference
Condition Assessment
- Satisfactory
- No existing or potential dam safety deficiencies are recognized. Acceptable performance is expected under all loading conditions (static, hydrologic, seismic) in accordance with the minimum applicable state or federal regulatory criteria or tolerable risk guidelines.
- Fair
- No existing dam safety deficiencies are recognized for normal operating conditions. Rare or extreme hydrologic and/or seismic events may result in a dam safety deficiency. Risk may be in the range to take further action.
- Poor
- A dam safety deficiency is recognized for normal operating conditions which may realistically occur. Remedial action is necessary. POOR may also be used when uncertainties exist as to critical analysis parameters which identify a potential dam safety deficiency.
- Unsatisfactory
- A dam safety deficiency is recognized that requires immediate or emergency remedial action for problem resolution.
- Not Rated
- The dam has not been inspected, is not under state or federal jurisdiction, or has been inspected but, for whatever reason, has not been rated.
Hazard Potential Classification
- High
- Dams assigned the high hazard potential classification are those where failure or mis-operation will probably cause loss of human life.
- Significant
- Dams assigned the significant hazard potential classification are those dams where failure or mis-operation results in no probable loss of human life but can cause economic loss, environmental damage, disruption of lifeline facilities, or impact other concerns. Significant hazard potential classification dams are often located in predominantly rural or agricultural areas but could be in areas with population and significant infrastructure.
- Low
- Dams assigned the low hazard potential classification are those where failure or mis-operation results in no probable loss of human life and low economic and/or environmental losses. Losses are principally limited to the owner's property.
- Undetermined
- Dams for which a downstream hazard potential has not been designated or is not provided.