Sapp Irrigation Pond Dam Dam

Sapp Irrigation Pond Dam
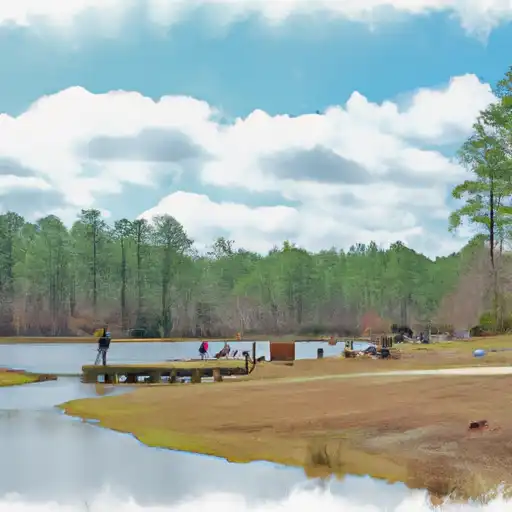
Sapp Irrigation Pond Dam in Toombs, Georgia, is a private earth dam primarily used for recreational purposes. The dam stands at a height of 16 feet and spans 350 feet in length, with a storage capacity of 90 acre-feet and a surface area of 10 acres. Despite being unregulated by the state, the dam is considered to have low hazard potential and a moderate risk level.
Located within the Savannah District of the US Army Corps of Engineers, Sapp Irrigation Pond Dam features an uncontrolled spillway and outlet gates. The dam has not been rated for its condition assessment, and there is no information available on its construction date or any recent modifications. With the absence of a formal Emergency Action Plan (EAP) and updated emergency contacts, the dam's risk management measures and preparedness for potential hazards remain unclear.
Although Sapp Irrigation Pond Dam may not be subject to state regulations or inspections, its role in providing recreational opportunities and water storage highlights the importance of monitoring its condition and implementing necessary safety measures. As water resource and climate enthusiasts, understanding the risk factors associated with dams like Sapp Irrigation Pond Dam can contribute to better decision-making and mitigation strategies in safeguarding these vital water infrastructure assets.
Plan around the weather
Same NOAA / yr.no feed Snoflo's iOS app uses. Watch the precipitation column on the meteogram -- rain on the basin upstream typically lifts inflow 24-72 hours later.
Next 5 days, hour by hour
Temperature line with weather symbols on top, snow + rain accumulation as columns, humidity as a dotted line.
5-day forecast table
Every 3 hours, broken out across temperature, snow, rain, humidity, and wind. Each cell is colour-coded relative to the column min/max.
| Time | Condition | Temp (°F) | Snow (in) | Rain (in) | Humidity (%) | Wind (mps) | Wind dir |
|---|---|---|---|---|---|---|---|
| Loading detailed forecast… | |||||||
15-day temperature & precipitation
Daily temperatures, snow, and rain projected over the next two weeks.
Nearby streamflow gauges
USGS streamgauges around Sapp Irrigation Pond Dam -- inflows here typically show up in storage 24-72 hours later.
| Streamgauge | Discharge | View |
|---|---|---|
| Altamaha River Near Baxley | 5,320 cfs | → |
| Ohoopee River Near Reidsville | 138 cfs | → |
| Oconee River Near Mount Vernon | 1,460 cfs | → |
| Ocmulgee River At Lumber City | 3,240 cfs | → |
| Canoochee River Near Claxton | 111 cfs | → |
| Turnpike Creek Near Mcrae | 0 cfs | → |


About Sapp Irrigation Pond Dam
Where does the data for Sapp Irrigation Pond Dam come from?
Structural and regulatory data come from the U.S. Army Corps of Engineers' National Inventory of Dams (NID). Weather forecast comes from NOAA / yr.no -- the same feed Snoflo's iOS app uses.
How often is the report updated?
NID structural data refreshes annually as the Corps publishes updated assessments. The weather forecast refreshes throughout the day.
What does the Low hazard rating mean?
The Corps of Engineers' hazard potential classification grades probable consequences if the dam fails: High = probable loss of human life; Significant = no probable loss of human life but possible economic loss / environmental damage; Low = no probable loss of human life, only minor economic / environmental losses. See the Dam Data Reference card below for the full definitions.
What's "% of normal"?
The current storage value compared to the historical average storage on this calendar day. 100% = right on average; values above 100% mean above-normal storage (wet year); values below mean below-normal (dry year or drought).
Can I get alerts when storage crosses a threshold?
Yes -- alerts are managed in the Snoflo iOS app. Favorite this dam, set a threshold, and you'll get a push the moment conditions cross.
Dam data reference
Condition Assessment
- Satisfactory
- No existing or potential dam safety deficiencies are recognized. Acceptable performance is expected under all loading conditions (static, hydrologic, seismic) in accordance with the minimum applicable state or federal regulatory criteria or tolerable risk guidelines.
- Fair
- No existing dam safety deficiencies are recognized for normal operating conditions. Rare or extreme hydrologic and/or seismic events may result in a dam safety deficiency. Risk may be in the range to take further action.
- Poor
- A dam safety deficiency is recognized for normal operating conditions which may realistically occur. Remedial action is necessary. POOR may also be used when uncertainties exist as to critical analysis parameters which identify a potential dam safety deficiency.
- Unsatisfactory
- A dam safety deficiency is recognized that requires immediate or emergency remedial action for problem resolution.
- Not Rated
- The dam has not been inspected, is not under state or federal jurisdiction, or has been inspected but, for whatever reason, has not been rated.
Hazard Potential Classification
- High
- Dams assigned the high hazard potential classification are those where failure or mis-operation will probably cause loss of human life.
- Significant
- Dams assigned the significant hazard potential classification are those dams where failure or mis-operation results in no probable loss of human life but can cause economic loss, environmental damage, disruption of lifeline facilities, or impact other concerns. Significant hazard potential classification dams are often located in predominantly rural or agricultural areas but could be in areas with population and significant infrastructure.
- Low
- Dams assigned the low hazard potential classification are those where failure or mis-operation results in no probable loss of human life and low economic and/or environmental losses. Losses are principally limited to the owner's property.
- Undetermined
- Dams for which a downstream hazard potential has not been designated or is not provided.