Good Hope Farms Pond Dam

Good Hope Farms Pond
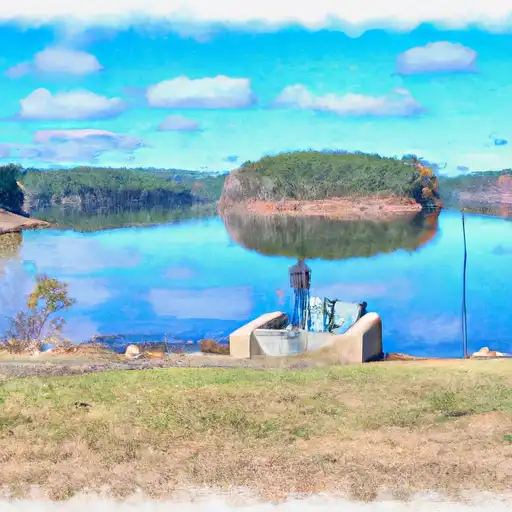
Good Hope Farms Pond, also known as Walter Hope Bryan Pond, is a private fish and wildlife pond located in Houston County, Alabama. Built in 1994 by the USDA NRCS, this Earth dam structure stands at 22 feet high and spans 500 feet in length. With a storage capacity of 162 acre-feet and a surface area of 10 acres, the pond serves multiple purposes including fire protection, stock, irrigation, and recreation.
Situated along TR OMUSEE CREEK, the Good Hope Farms Pond is managed by the Natural Resources Conservation Service and falls under the jurisdiction of the Mobile District of the US Army Corps of Engineers. Despite its low hazard potential and moderate risk assessment, the pond's condition is currently not rated, and no emergency action plan or inundation maps have been prepared. While the pond does not have a designated inspection frequency, it serves as a valuable resource for the local community and offers a habitat for various wildlife species.
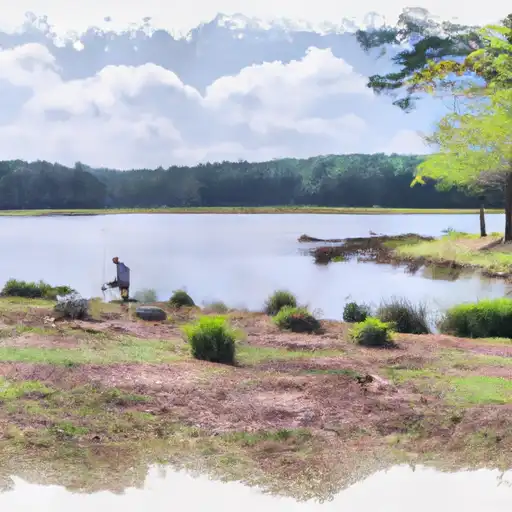
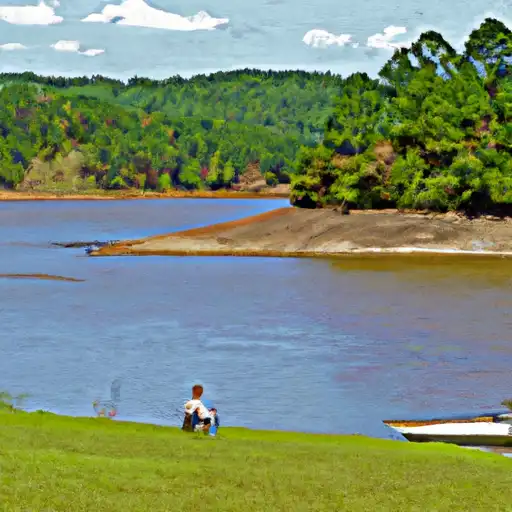
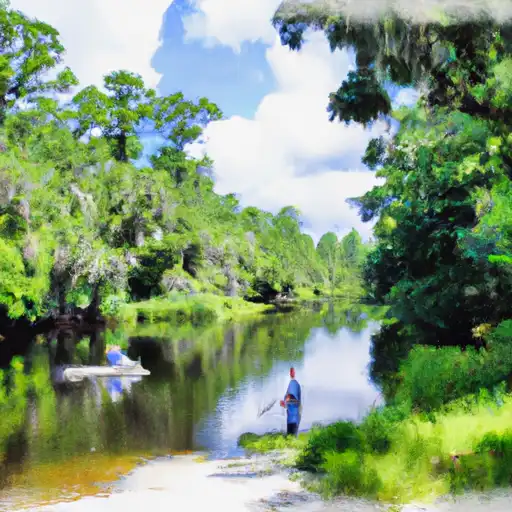
With its tranquil setting and diverse uses, Good Hope Farms Pond is a testament to sustainable water resource management and conservation efforts. As a vital part of the local ecosystem, this pond not only provides recreational opportunities but also supports the region's biodiversity. As climate change continues to impact water resources, initiatives like the Good Hope Farms Pond demonstrate the importance of responsible stewardship and the role of private landowners in preserving our natural environment for future generations.
Plan around the weather
Same NOAA / yr.no feed Snoflo's iOS app uses. Watch the precipitation column on the meteogram -- rain on the basin upstream typically lifts inflow 24-72 hours later.
Next 5 days, hour by hour
Temperature line with weather symbols on top, snow + rain accumulation as columns, humidity as a dotted line.
5-day forecast table
Every 3 hours, broken out across temperature, snow, rain, humidity, and wind. Each cell is colour-coded relative to the column min/max.
| Time | Condition | Temp (°F) | Snow (in) | Rain (in) | Humidity (%) | Wind (mps) | Wind dir |
|---|---|---|---|---|---|---|---|
| Loading detailed forecast… | |||||||
15-day temperature & precipitation
Daily temperatures, snow, and rain projected over the next two weeks.
Nearby streamflow gauges
USGS streamgauges around Good Hope Farms Pond -- inflows here typically show up in storage 24-72 hours later.
| Streamgauge | Discharge | View |
|---|---|---|
| Sawhatchee Creek At Cedar Springs | 56 cfs | → |
| Spring Creek Near Iron City | 227 cfs | → |
| Choctawhatchee River Near Newton | 221 cfs | → |
| Pachitla Creek Near Edison | 61 cfs | → |
| Ichawaynochaway Creek At Milford | 322 cfs | → |
| Spring Creek Near Reynoldsville | 303 cfs | → |


About Good Hope Farms Pond
Where does the data for Good Hope Farms Pond come from?
Structural and regulatory data come from the U.S. Army Corps of Engineers' National Inventory of Dams (NID). Weather forecast comes from NOAA / yr.no -- the same feed Snoflo's iOS app uses.
How often is the report updated?
NID structural data refreshes annually as the Corps publishes updated assessments. The weather forecast refreshes throughout the day.
What does the Low hazard rating mean?
The Corps of Engineers' hazard potential classification grades probable consequences if the dam fails: High = probable loss of human life; Significant = no probable loss of human life but possible economic loss / environmental damage; Low = no probable loss of human life, only minor economic / environmental losses. See the Dam Data Reference card below for the full definitions.
What's "% of normal"?
The current storage value compared to the historical average storage on this calendar day. 100% = right on average; values above 100% mean above-normal storage (wet year); values below mean below-normal (dry year or drought).
Can I get alerts when storage crosses a threshold?
Yes -- alerts are managed in the Snoflo iOS app. Favorite this dam, set a threshold, and you'll get a push the moment conditions cross.
Dam data reference
Condition Assessment
- Satisfactory
- No existing or potential dam safety deficiencies are recognized. Acceptable performance is expected under all loading conditions (static, hydrologic, seismic) in accordance with the minimum applicable state or federal regulatory criteria or tolerable risk guidelines.
- Fair
- No existing dam safety deficiencies are recognized for normal operating conditions. Rare or extreme hydrologic and/or seismic events may result in a dam safety deficiency. Risk may be in the range to take further action.
- Poor
- A dam safety deficiency is recognized for normal operating conditions which may realistically occur. Remedial action is necessary. POOR may also be used when uncertainties exist as to critical analysis parameters which identify a potential dam safety deficiency.
- Unsatisfactory
- A dam safety deficiency is recognized that requires immediate or emergency remedial action for problem resolution.
- Not Rated
- The dam has not been inspected, is not under state or federal jurisdiction, or has been inspected but, for whatever reason, has not been rated.
Hazard Potential Classification
- High
- Dams assigned the high hazard potential classification are those where failure or mis-operation will probably cause loss of human life.
- Significant
- Dams assigned the significant hazard potential classification are those dams where failure or mis-operation results in no probable loss of human life but can cause economic loss, environmental damage, disruption of lifeline facilities, or impact other concerns. Significant hazard potential classification dams are often located in predominantly rural or agricultural areas but could be in areas with population and significant infrastructure.
- Low
- Dams assigned the low hazard potential classification are those where failure or mis-operation results in no probable loss of human life and low economic and/or environmental losses. Losses are principally limited to the owner's property.
- Undetermined
- Dams for which a downstream hazard potential has not been designated or is not provided.