Bradshaw Detention Dam #4 Dam

Bradshaw Detention Dam #4
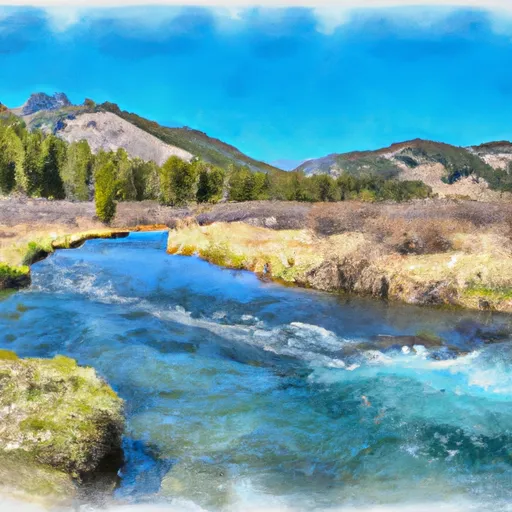
Bradshaw Detention Dam #4, located in Idaho along the Bradshaw Gulch, was completed in 1967 to primarily serve as a flood risk reduction structure. This gravity dam has a hydraulic height of 43 feet and a structural height of 49 feet, with a storage capacity of 120 acre-feet. The dam is owned, funded, designed, constructed, regulated, inspected, and operated by the Bureau of Land Management, showcasing federal involvement in its management.
With a low hazard potential and a moderate risk assessment rating, Bradshaw Detention Dam #4 has not been rated for its current condition. The dam features an uncontrolled spillway with a width of 2 feet and has not been modified in recent years. While the last inspection took place in 2007, the dam's emergency action plan status, inundation maps, risk management measures, and other related aspects remain unlisted, highlighting potential areas for improvement in the future.
Overall, Bradshaw Detention Dam #4 stands as a key infrastructure for flood risk reduction in the region, showcasing federal agency oversight and involvement. As water resource and climate enthusiasts, further updates on the dam's condition, risk management measures, and emergency preparedness would provide valuable insights into its ongoing effectiveness in safeguarding the surrounding area from potential flooding events.
Plan around the weather
Same NOAA / yr.no feed Snoflo's iOS app uses. Watch the precipitation column on the meteogram -- rain on the basin upstream typically lifts inflow 24-72 hours later.
Next 5 days, hour by hour
Temperature line with weather symbols on top, snow + rain accumulation as columns, humidity as a dotted line.
5-day forecast table
Every 3 hours, broken out across temperature, snow, rain, humidity, and wind. Each cell is colour-coded relative to the column min/max.
| Time | Condition | Temp (°F) | Snow (in) | Rain (in) | Humidity (%) | Wind (mps) | Wind dir |
|---|---|---|---|---|---|---|---|
| Loading detailed forecast… | |||||||
15-day temperature & precipitation
Daily temperatures, snow, and rain projected over the next two weeks.
Nearby streamflow gauges
USGS streamgauges around Bradshaw Detention Dam #4 -- inflows here typically show up in storage 24-72 hours later.
| Streamgauge | Discharge | View |
|---|---|---|
| Squaw Creek Bl Bruno Creek Nr Clayton Id | 12 cfs | → |
| Thompson Creek Nr Clayton Id | 6 cfs | → |
| Pahsimeroi River At Ellis Id | 110 cfs | → |
| Yankee Fork Salmon River Nr Clayton Id | 110 cfs | → |
| Salmon River Bl Yankee Fork Nr Clayton Id | 750 cfs | → |
| Big Lost River At Howell Ranch Nr Chilly Id | 216 cfs | → |


About Bradshaw Detention Dam #4
Where does the data for Bradshaw Detention Dam #4 come from?
Structural and regulatory data come from the U.S. Army Corps of Engineers' National Inventory of Dams (NID). Weather forecast comes from NOAA / yr.no -- the same feed Snoflo's iOS app uses.
How often is the report updated?
NID structural data refreshes annually as the Corps publishes updated assessments. The weather forecast refreshes throughout the day.
What does the Low hazard rating mean?
The Corps of Engineers' hazard potential classification grades probable consequences if the dam fails: High = probable loss of human life; Significant = no probable loss of human life but possible economic loss / environmental damage; Low = no probable loss of human life, only minor economic / environmental losses. See the Dam Data Reference card below for the full definitions.
What's "% of normal"?
The current storage value compared to the historical average storage on this calendar day. 100% = right on average; values above 100% mean above-normal storage (wet year); values below mean below-normal (dry year or drought).
Can I get alerts when storage crosses a threshold?
Yes -- alerts are managed in the Snoflo iOS app. Favorite this dam, set a threshold, and you'll get a push the moment conditions cross.
Dam data reference
Condition Assessment
- Satisfactory
- No existing or potential dam safety deficiencies are recognized. Acceptable performance is expected under all loading conditions (static, hydrologic, seismic) in accordance with the minimum applicable state or federal regulatory criteria or tolerable risk guidelines.
- Fair
- No existing dam safety deficiencies are recognized for normal operating conditions. Rare or extreme hydrologic and/or seismic events may result in a dam safety deficiency. Risk may be in the range to take further action.
- Poor
- A dam safety deficiency is recognized for normal operating conditions which may realistically occur. Remedial action is necessary. POOR may also be used when uncertainties exist as to critical analysis parameters which identify a potential dam safety deficiency.
- Unsatisfactory
- A dam safety deficiency is recognized that requires immediate or emergency remedial action for problem resolution.
- Not Rated
- The dam has not been inspected, is not under state or federal jurisdiction, or has been inspected but, for whatever reason, has not been rated.
Hazard Potential Classification
- High
- Dams assigned the high hazard potential classification are those where failure or mis-operation will probably cause loss of human life.
- Significant
- Dams assigned the significant hazard potential classification are those dams where failure or mis-operation results in no probable loss of human life but can cause economic loss, environmental damage, disruption of lifeline facilities, or impact other concerns. Significant hazard potential classification dams are often located in predominantly rural or agricultural areas but could be in areas with population and significant infrastructure.
- Low
- Dams assigned the low hazard potential classification are those where failure or mis-operation results in no probable loss of human life and low economic and/or environmental losses. Losses are principally limited to the owner's property.
- Undetermined
- Dams for which a downstream hazard potential has not been designated or is not provided.