Echo Valley Lake Dam Dam

Echo Valley Lake Dam
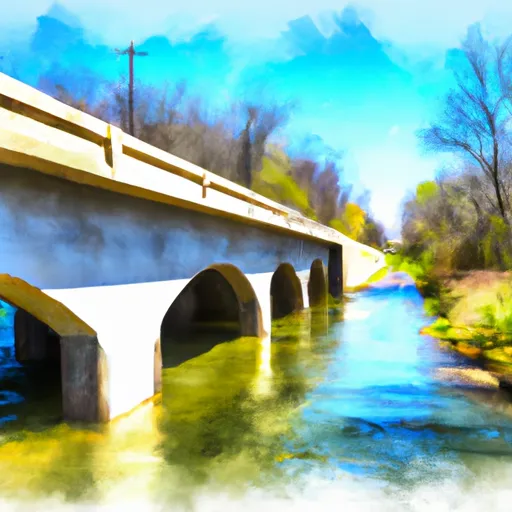
Echo Valley Lake Dam, nestled in Perry County, Indiana, is a privately owned structure designed by the USDA NRCS and completed in 1961 for the primary purpose of recreation. Standing at a height of 33 feet and stretching 550 feet in length, this earth dam holds a maximum storage capacity of 132 acre-feet, with a normal storage of 88 acre-feet. The dam overlooks the picturesque Little Deer Creek and boasts a surface area of 10 acres, providing a tranquil escape for water resource and climate enthusiasts.
Despite its low hazard potential and fair condition assessment, Echo Valley Lake Dam is subject to regular state regulation, inspection, and enforcement by the Indiana Department of Natural Resources. The dam has a hydraulic height of 30 feet and a maximum discharge capacity of 2553 cubic feet per second. It lacks a spillway, outlet gates, and associated structures, but its location in the Louisville District ensures oversight by the Natural Resources Conservation Service.
While Echo Valley Lake Dam has not undergone recent modifications, its risk assessment indicates a high level of vulnerability (level 2). The dam's emergency action plan and inundation maps are not up-to-date, raising concerns for potential risk management measures in the event of a crisis. With a notable presence in the scenic Cannelton area, this dam stands as a captivating site for those interested in water resource management and climate resilience efforts.
Plan around the weather
Same NOAA / yr.no feed Snoflo's iOS app uses. Watch the precipitation column on the meteogram -- rain on the basin upstream typically lifts inflow 24-72 hours later.
Next 5 days, hour by hour
Temperature line with weather symbols on top, snow + rain accumulation as columns, humidity as a dotted line.
5-day forecast table
Every 3 hours, broken out across temperature, snow, rain, humidity, and wind. Each cell is colour-coded relative to the column min/max.
| Time | Condition | Temp (°F) | Snow (in) | Rain (in) | Humidity (%) | Wind (mps) | Wind dir |
|---|---|---|---|---|---|---|---|
| Loading detailed forecast… | |||||||
15-day temperature & precipitation
Daily temperatures, snow, and rain projected over the next two weeks.
Nearby streamflow gauges
USGS streamgauges around Echo Valley Lake Dam -- inflows here typically show up in storage 24-72 hours later.
| Streamgauge | Discharge | View |
|---|---|---|
| Ohio River At Cannelton Dam At Cannelton | 43,000 cfs | → |
| Middle Fork Anderson River At Bristow | 16 cfs | → |
| South Fork Panther Creek Near Whitesville | 13 cfs | → |
| Caney Creek Near Horse Branch | 85 cfs | → |
| Blue River Near White Cloud | 295 cfs | → |
| Patoka River At Jasper | 215 cfs | → |
Make a day of it
Boat launches, lakeside camping, fishing access, and other reservoirs near Echo Valley Lake Dam.
Boat launches
See all →


Campgrounds
See all →


River runs
See all →


About Echo Valley Lake Dam
Where does the data for Echo Valley Lake Dam come from?
Structural and regulatory data come from the U.S. Army Corps of Engineers' National Inventory of Dams (NID). Weather forecast comes from NOAA / yr.no -- the same feed Snoflo's iOS app uses.
How often is the report updated?
NID structural data refreshes annually as the Corps publishes updated assessments. The weather forecast refreshes throughout the day.
What does the Low hazard rating mean?
The Corps of Engineers' hazard potential classification grades probable consequences if the dam fails: High = probable loss of human life; Significant = no probable loss of human life but possible economic loss / environmental damage; Low = no probable loss of human life, only minor economic / environmental losses. See the Dam Data Reference card below for the full definitions.
What's "% of normal"?
The current storage value compared to the historical average storage on this calendar day. 100% = right on average; values above 100% mean above-normal storage (wet year); values below mean below-normal (dry year or drought).
Can I get alerts when storage crosses a threshold?
Yes -- alerts are managed in the Snoflo iOS app. Favorite this dam, set a threshold, and you'll get a push the moment conditions cross.
Dam data reference
Condition Assessment
- Satisfactory
- No existing or potential dam safety deficiencies are recognized. Acceptable performance is expected under all loading conditions (static, hydrologic, seismic) in accordance with the minimum applicable state or federal regulatory criteria or tolerable risk guidelines.
- Fair
- No existing dam safety deficiencies are recognized for normal operating conditions. Rare or extreme hydrologic and/or seismic events may result in a dam safety deficiency. Risk may be in the range to take further action.
- Poor
- A dam safety deficiency is recognized for normal operating conditions which may realistically occur. Remedial action is necessary. POOR may also be used when uncertainties exist as to critical analysis parameters which identify a potential dam safety deficiency.
- Unsatisfactory
- A dam safety deficiency is recognized that requires immediate or emergency remedial action for problem resolution.
- Not Rated
- The dam has not been inspected, is not under state or federal jurisdiction, or has been inspected but, for whatever reason, has not been rated.
Hazard Potential Classification
- High
- Dams assigned the high hazard potential classification are those where failure or mis-operation will probably cause loss of human life.
- Significant
- Dams assigned the significant hazard potential classification are those dams where failure or mis-operation results in no probable loss of human life but can cause economic loss, environmental damage, disruption of lifeline facilities, or impact other concerns. Significant hazard potential classification dams are often located in predominantly rural or agricultural areas but could be in areas with population and significant infrastructure.
- Low
- Dams assigned the low hazard potential classification are those where failure or mis-operation results in no probable loss of human life and low economic and/or environmental losses. Losses are principally limited to the owner's property.
- Undetermined
- Dams for which a downstream hazard potential has not been designated or is not provided.