Lake Gallimore Dam Dam

Lake Gallimore Dam
Lake Gallimore Dam, also known as Boggs Creek Dam No.1, is a Federal-owned structure located in Loogootee, Indiana. Built in 1962 by the Natural Resources Conservation Service and the US Navy, this Earth-type dam serves the primary purpose of flood risk reduction along Boggs Creek. With a height of 26 feet and a length of 890 feet, the dam has a storage capacity of 6,740 acre-feet and covers a surface area of 102 acres.
The dam features an uncontrolled spillway with a width of 870 feet, allowing for a maximum discharge of 21,982 cubic feet per second. Despite its significant hazard potential, Lake Gallimore Dam is currently in satisfactory condition, as assessed during the last inspection in June 2021. The dam is not regulated by the state of Indiana and has not been modified since its completion, reflecting its stable and reliable infrastructure for managing water resources in the region.
Water resource and climate enthusiasts will appreciate the strategic design and operational efficiency of Lake Gallimore Dam in mitigating flood risks along Boggs Creek. As a key component of the flood control system in Martin County, Indiana, this dam exemplifies the collaboration between federal agencies and local stakeholders to ensure the safety and resilience of the surrounding community. Its location, capacity, and maintenance history make Lake Gallimore Dam a noteworthy structure for those interested in sustainable water management practices and climate adaptation strategies.
Plan around the weather
Same NOAA / yr.no feed Snoflo's iOS app uses. Watch the precipitation column on the meteogram -- rain on the basin upstream typically lifts inflow 24-72 hours later.
Next 5 days, hour by hour
Temperature line with weather symbols on top, snow + rain accumulation as columns, humidity as a dotted line.
5-day forecast table
Every 3 hours, broken out across temperature, snow, rain, humidity, and wind. Each cell is colour-coded relative to the column min/max.
| Time | Condition | Temp (°F) | Snow (in) | Rain (in) | Humidity (%) | Wind (mps) | Wind dir |
|---|---|---|---|---|---|---|---|
| Loading detailed forecast… | |||||||
15-day temperature & precipitation
Daily temperatures, snow, and rain projected over the next two weeks.
Nearby streamflow gauges
USGS streamgauges around Lake Gallimore Dam -- inflows here typically show up in storage 24-72 hours later.
| Streamgauge | Discharge | View |
|---|---|---|
| East Fork White River At Shoals | 4,570 cfs | → |
| White River At Newberry | 2,450 cfs | → |
| Patoka River At Jasper | 215 cfs | → |
| East Fork White River Near Bedford | 1,730 cfs | → |
| White River Above Petersburg | 1,500 cfs | → |
| White River At Petersburg | 10,200 cfs | → |
Make a day of it
Boat launches, lakeside camping, fishing access, and other reservoirs near Lake Gallimore Dam.
Boat launches
See all →


Campgrounds
See all →


Fishing spots
See all →


River runs
See all →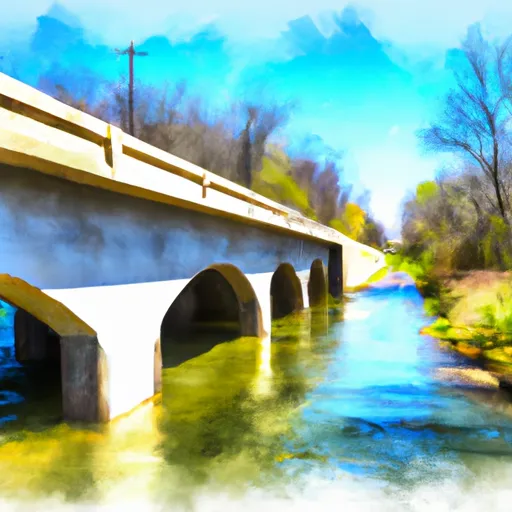


About Lake Gallimore Dam
Where does the data for Lake Gallimore Dam come from?
Structural and regulatory data come from the U.S. Army Corps of Engineers' National Inventory of Dams (NID). Weather forecast comes from NOAA / yr.no -- the same feed Snoflo's iOS app uses.
How often is the report updated?
NID structural data refreshes annually as the Corps publishes updated assessments. The weather forecast refreshes throughout the day.
What does the Significant hazard rating mean?
The Corps of Engineers' hazard potential classification grades probable consequences if the dam fails: High = probable loss of human life; Significant = no probable loss of human life but possible economic loss / environmental damage; Low = no probable loss of human life, only minor economic / environmental losses. See the Dam Data Reference card below for the full definitions.
What's "% of normal"?
The current storage value compared to the historical average storage on this calendar day. 100% = right on average; values above 100% mean above-normal storage (wet year); values below mean below-normal (dry year or drought).
Can I get alerts when storage crosses a threshold?
Yes -- alerts are managed in the Snoflo iOS app. Favorite this dam, set a threshold, and you'll get a push the moment conditions cross.
Dam data reference
Condition Assessment
- Satisfactory
- No existing or potential dam safety deficiencies are recognized. Acceptable performance is expected under all loading conditions (static, hydrologic, seismic) in accordance with the minimum applicable state or federal regulatory criteria or tolerable risk guidelines.
- Fair
- No existing dam safety deficiencies are recognized for normal operating conditions. Rare or extreme hydrologic and/or seismic events may result in a dam safety deficiency. Risk may be in the range to take further action.
- Poor
- A dam safety deficiency is recognized for normal operating conditions which may realistically occur. Remedial action is necessary. POOR may also be used when uncertainties exist as to critical analysis parameters which identify a potential dam safety deficiency.
- Unsatisfactory
- A dam safety deficiency is recognized that requires immediate or emergency remedial action for problem resolution.
- Not Rated
- The dam has not been inspected, is not under state or federal jurisdiction, or has been inspected but, for whatever reason, has not been rated.
Hazard Potential Classification
- High
- Dams assigned the high hazard potential classification are those where failure or mis-operation will probably cause loss of human life.
- Significant
- Dams assigned the significant hazard potential classification are those dams where failure or mis-operation results in no probable loss of human life but can cause economic loss, environmental damage, disruption of lifeline facilities, or impact other concerns. Significant hazard potential classification dams are often located in predominantly rural or agricultural areas but could be in areas with population and significant infrastructure.
- Low
- Dams assigned the low hazard potential classification are those where failure or mis-operation results in no probable loss of human life and low economic and/or environmental losses. Losses are principally limited to the owner's property.
- Undetermined
- Dams for which a downstream hazard potential has not been designated or is not provided.