Lakeview Farm Dam Dam

Lakeview Farm Dam
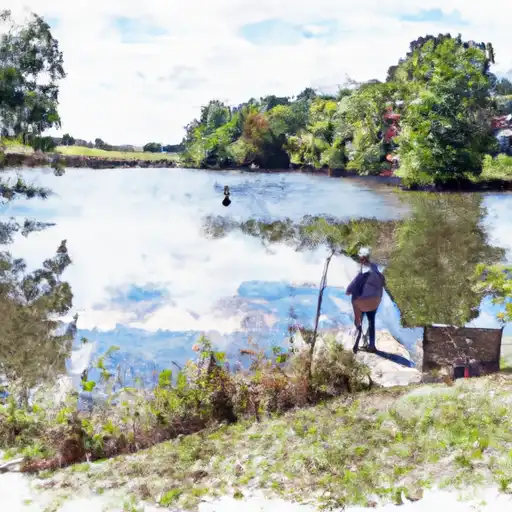
Lakeview Farm Dam, also known as Lakeview Farm Lake, is a private recreational dam located in Boone County, Kentucky. Constructed in 1973, this earth dam stands at a height of 55 feet and spans a length of 615 feet, creating a reservoir with a storage capacity of 220 acre-feet and a surface area of 7.4 acres. The dam is regulated by the Kentucky Division of Water, with state permitting, inspection, and enforcement in place to ensure its safety and compliance.
Situated on Elyahs Creek, Lakeview Farm Dam serves as a popular spot for outdoor activities and water recreation in the city of Taylorsport. Despite its uncontrolled spillway, the dam has a low hazard potential and a moderate risk assessment rating. Although its condition is not currently rated, regular inspections are conducted every five years to monitor its safety and structural integrity. The dam's emergency action plan status and risk management measures remain undisclosed, but the dam is deemed to meet regulatory guidelines and is not under the jurisdiction of the US Army Corps of Engineers.
Overall, Lakeview Farm Dam presents a fascinating case study for water resource and climate enthusiasts, showcasing the importance of private dam ownership and state regulation in ensuring the safety and sustainability of recreational water infrastructure. With its serene surroundings and moderate risk profile, this dam serves as a valuable asset for the local community while highlighting the need for ongoing maintenance and monitoring to mitigate potential hazards and safeguard the environment.
Plan around the weather
Same NOAA / yr.no feed Snoflo's iOS app uses. Watch the precipitation column on the meteogram -- rain on the basin upstream typically lifts inflow 24-72 hours later.
Next 5 days, hour by hour
Temperature line with weather symbols on top, snow + rain accumulation as columns, humidity as a dotted line.
5-day forecast table
Every 3 hours, broken out across temperature, snow, rain, humidity, and wind. Each cell is colour-coded relative to the column min/max.
| Time | Condition | Temp (°F) | Snow (in) | Rain (in) | Humidity (%) | Wind (mps) | Wind dir |
|---|---|---|---|---|---|---|---|
| Loading detailed forecast… | |||||||
15-day temperature & precipitation
Daily temperatures, snow, and rain projected over the next two weeks.
Nearby streamflow gauges
USGS streamgauges around Lakeview Farm Dam -- inflows here typically show up in storage 24-72 hours later.
| Streamgauge | Discharge | View |
|---|---|---|
| Elijahs Creek @ Elijahs Creek Rd Nr Hebron | 41 cfs | → |
| Gunpowder Cr At Camp Ernst Rd Nr Union | 398 cfs | → |
| Woolper Creek At Woolper Road Near Burlington | 17 cfs | → |
| Banklick Creek @ Highway 1829 Nr Erlanger | 196 cfs | → |
| Mill Creek At Carthage Oh | 36 cfs | → |
| Mud Lick Cr At Hwy 42 Nr Beaverlick | 16 cfs | → |


About Lakeview Farm Dam
Where does the data for Lakeview Farm Dam come from?
Structural and regulatory data come from the U.S. Army Corps of Engineers' National Inventory of Dams (NID). Weather forecast comes from NOAA / yr.no -- the same feed Snoflo's iOS app uses.
How often is the report updated?
NID structural data refreshes annually as the Corps publishes updated assessments. The weather forecast refreshes throughout the day.
What does the Low hazard rating mean?
The Corps of Engineers' hazard potential classification grades probable consequences if the dam fails: High = probable loss of human life; Significant = no probable loss of human life but possible economic loss / environmental damage; Low = no probable loss of human life, only minor economic / environmental losses. See the Dam Data Reference card below for the full definitions.
What's "% of normal"?
The current storage value compared to the historical average storage on this calendar day. 100% = right on average; values above 100% mean above-normal storage (wet year); values below mean below-normal (dry year or drought).
Can I get alerts when storage crosses a threshold?
Yes -- alerts are managed in the Snoflo iOS app. Favorite this dam, set a threshold, and you'll get a push the moment conditions cross.
Dam data reference
Condition Assessment
- Satisfactory
- No existing or potential dam safety deficiencies are recognized. Acceptable performance is expected under all loading conditions (static, hydrologic, seismic) in accordance with the minimum applicable state or federal regulatory criteria or tolerable risk guidelines.
- Fair
- No existing dam safety deficiencies are recognized for normal operating conditions. Rare or extreme hydrologic and/or seismic events may result in a dam safety deficiency. Risk may be in the range to take further action.
- Poor
- A dam safety deficiency is recognized for normal operating conditions which may realistically occur. Remedial action is necessary. POOR may also be used when uncertainties exist as to critical analysis parameters which identify a potential dam safety deficiency.
- Unsatisfactory
- A dam safety deficiency is recognized that requires immediate or emergency remedial action for problem resolution.
- Not Rated
- The dam has not been inspected, is not under state or federal jurisdiction, or has been inspected but, for whatever reason, has not been rated.
Hazard Potential Classification
- High
- Dams assigned the high hazard potential classification are those where failure or mis-operation will probably cause loss of human life.
- Significant
- Dams assigned the significant hazard potential classification are those dams where failure or mis-operation results in no probable loss of human life but can cause economic loss, environmental damage, disruption of lifeline facilities, or impact other concerns. Significant hazard potential classification dams are often located in predominantly rural or agricultural areas but could be in areas with population and significant infrastructure.
- Low
- Dams assigned the low hazard potential classification are those where failure or mis-operation results in no probable loss of human life and low economic and/or environmental losses. Losses are principally limited to the owner's property.
- Undetermined
- Dams for which a downstream hazard potential has not been designated or is not provided.