Jennings Randolph Dam dam

Jennings Randolph Dam
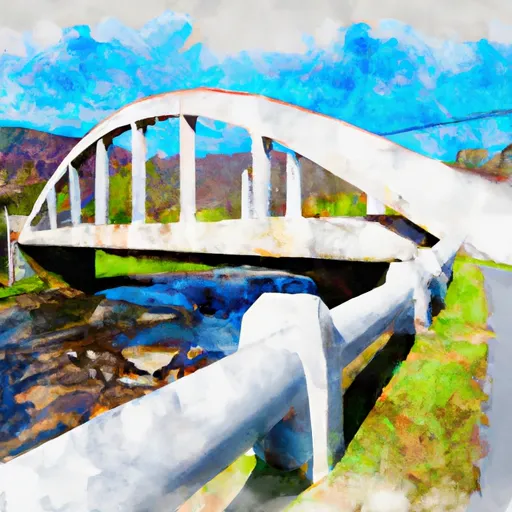
Jennings Randolph Dam, located in Garrett County, Maryland, is a crucial structure managed by the U.S. Army Corps of Engineers to reduce flood risk for downstream communities along the North Branch Potomac River. Completed in 1981, this rockfill dam stands at a height of 296 feet and has a storage capacity of 130,900 acre-feet. While the dam plays a vital role in mitigating flooding, there are still potential risks associated with high-volume water releases from the spillway during significant storm events.
In the event of a breach, communities such as Bloomington, Luke, Westernport, and Cumberland could face devastating flooding, with swift and deep floodwaters causing extensive damage to properties and infrastructure. To manage these risks, the USACE implements regular inspections, maintenance activities, and emergency response exercises to ensure the dam's integrity and readiness for any potential flood event. Despite the risks, the USACE's proactive risk management measures and preparedness efforts help safeguard downstream communities and reduce the likelihood of catastrophic flooding incidents.
Overall, Jennings Randolph Dam serves as a critical flood risk reduction infrastructure, highlighting the importance of ongoing monitoring, maintenance, and emergency preparedness to protect communities along the North Branch Potomac River from the impacts of potential dam-related flooding events.
Plan around the weather
Same NOAA / yr.no feed Snoflo's iOS app uses. Watch the precipitation column on the meteogram -- rain on the basin upstream typically lifts inflow 24-72 hours later.
Next 5 days, hour by hour
Temperature line with weather symbols on top, snow + rain accumulation as columns, humidity as a dotted line.
5-day forecast table
Every 3 hours, broken out across temperature, snow, rain, humidity, and wind. Each cell is colour-coded relative to the column min/max.
| Time | Condition | Temp (°F) | Snow (in) | Rain (in) | Humidity (%) | Wind (mps) | Wind dir |
|---|---|---|---|---|---|---|---|
| Loading detailed forecast… | |||||||
15-day temperature & precipitation
Daily temperatures, snow, and rain projected over the next two weeks.
Nearby streamflow gauges
USGS streamgauges around Jennings Randolph Dam -- inflows here typically show up in storage 24-72 hours later.
| Streamgauge | Discharge | View |
|---|---|---|
| North Branch Potomac River At Barnum | 305 cfs | → |
| North Branch Potomac River At Kitzmiller | 103 cfs | → |
| North Branch Potomac River At Luke | 372 cfs | → |
| Savage Riv Bl Savage Riv Dam Near Bloomington | 63 cfs | → |
| Crabtree Creek Near Swanton | 154 cfs | → |
| Abram Creek At Oakmont | 10 cfs | → |
Make a day of it
Boat launches, lakeside camping, fishing access, and other reservoirs near Jennings Randolph Dam.
Boat launches
See all →


Campgrounds
See all →


Fishing spots
See all →


River runs
See all →


About Jennings Randolph Dam
Where does the data for Jennings Randolph Dam come from?
Structural and regulatory data come from the U.S. Army Corps of Engineers' National Inventory of Dams (NID). Weather forecast comes from NOAA / yr.no -- the same feed Snoflo's iOS app uses.
How often is the report updated?
NID structural data refreshes annually as the Corps publishes updated assessments. The weather forecast refreshes throughout the day.
What does the High hazard rating mean?
The Corps of Engineers' hazard potential classification grades probable consequences if the dam fails: High = probable loss of human life; Significant = no probable loss of human life but possible economic loss / environmental damage; Low = no probable loss of human life, only minor economic / environmental losses. See the Dam Data Reference card below for the full definitions.
What's "% of normal"?
The current storage value compared to the historical average storage on this calendar day. 100% = right on average; values above 100% mean above-normal storage (wet year); values below mean below-normal (dry year or drought).
Can I get alerts when storage crosses a threshold?
Yes -- alerts are managed in the Snoflo iOS app. Favorite this dam, set a threshold, and you'll get a push the moment conditions cross.
Dam data reference
Condition Assessment
- Satisfactory
- No existing or potential dam safety deficiencies are recognized. Acceptable performance is expected under all loading conditions (static, hydrologic, seismic) in accordance with the minimum applicable state or federal regulatory criteria or tolerable risk guidelines.
- Fair
- No existing dam safety deficiencies are recognized for normal operating conditions. Rare or extreme hydrologic and/or seismic events may result in a dam safety deficiency. Risk may be in the range to take further action.
- Poor
- A dam safety deficiency is recognized for normal operating conditions which may realistically occur. Remedial action is necessary. POOR may also be used when uncertainties exist as to critical analysis parameters which identify a potential dam safety deficiency.
- Unsatisfactory
- A dam safety deficiency is recognized that requires immediate or emergency remedial action for problem resolution.
- Not Rated
- The dam has not been inspected, is not under state or federal jurisdiction, or has been inspected but, for whatever reason, has not been rated.
Hazard Potential Classification
- High
- Dams assigned the high hazard potential classification are those where failure or mis-operation will probably cause loss of human life.
- Significant
- Dams assigned the significant hazard potential classification are those dams where failure or mis-operation results in no probable loss of human life but can cause economic loss, environmental damage, disruption of lifeline facilities, or impact other concerns. Significant hazard potential classification dams are often located in predominantly rural or agricultural areas but could be in areas with population and significant infrastructure.
- Low
- Dams assigned the low hazard potential classification are those where failure or mis-operation results in no probable loss of human life and low economic and/or environmental losses. Losses are principally limited to the owner's property.
- Undetermined
- Dams for which a downstream hazard potential has not been designated or is not provided.