Lee Pond Dam Dam

Lee Pond Dam
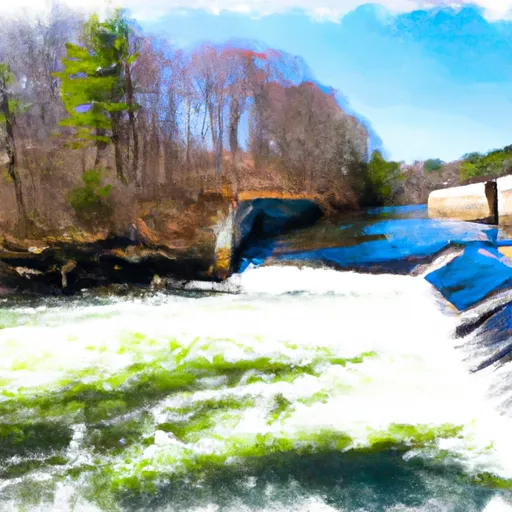
Lee Pond Dam, located in Uxbridge, Massachusetts, is a privately owned earth dam with a primary purpose of recreation. Built in 1880, the dam stands at a height of 26 feet and has a storage capacity of 189 acre-feet. It spans a length of 550 feet and impounds the waters of Emerson Brook, creating a surface area of 11.2 acres for recreational activities.
The dam is regulated by the Department of Conservation and Recreation in Massachusetts and is subject to state permitting, inspection, and enforcement. Despite being assessed as in fair condition during the last inspection in September 2013, it has a significant hazard potential due to its location and design. With a moderate risk level assigned, it is crucial for the dam owners to follow risk management measures and regularly update their emergency action plan to ensure the safety of the surrounding area in case of a potential failure.
Lee Pond Dam serves as both a recreational spot and a vital water resource in Worcester County, Massachusetts. With its historical significance dating back to the 19th century, the dam continues to be a focal point for water enthusiasts and climate advocates alike. As climate change impacts continue to pose challenges for water infrastructure, the importance of maintaining and managing structures like Lee Pond Dam becomes increasingly crucial for the sustainability of water resources in the region.
Plan around the weather
Same NOAA / yr.no feed Snoflo's iOS app uses. Watch the precipitation column on the meteogram -- rain on the basin upstream typically lifts inflow 24-72 hours later.
Next 5 days, hour by hour
Temperature line with weather symbols on top, snow + rain accumulation as columns, humidity as a dotted line.
5-day forecast table
Every 3 hours, broken out across temperature, snow, rain, humidity, and wind. Each cell is colour-coded relative to the column min/max.
| Time | Condition | Temp (°F) | Snow (in) | Rain (in) | Humidity (%) | Wind (mps) | Wind dir |
|---|---|---|---|---|---|---|---|
| Loading detailed forecast… | |||||||
15-day temperature & precipitation
Daily temperatures, snow, and rain projected over the next two weeks.
Nearby streamflow gauges
USGS streamgauges around Lee Pond Dam -- inflows here typically show up in storage 24-72 hours later.
| Streamgauge | Discharge | View |
|---|---|---|
| West River Below West Hill Dam | 1 cfs | → |
| Nipmuc River Near Harrisville | 1 cfs | → |
| Branch River At Forestdale | 22 cfs | → |
| Blackstone River At Northbridge | 1,000 cfs | → |
| Blackstone River At Woonsocket | 145 cfs | → |
| Blackstone River | 45 cfs | → |


About Lee Pond Dam
Where does the data for Lee Pond Dam come from?
Structural and regulatory data come from the U.S. Army Corps of Engineers' National Inventory of Dams (NID). Weather forecast comes from NOAA / yr.no -- the same feed Snoflo's iOS app uses.
How often is the report updated?
NID structural data refreshes annually as the Corps publishes updated assessments. The weather forecast refreshes throughout the day.
What does the Significant hazard rating mean?
The Corps of Engineers' hazard potential classification grades probable consequences if the dam fails: High = probable loss of human life; Significant = no probable loss of human life but possible economic loss / environmental damage; Low = no probable loss of human life, only minor economic / environmental losses. See the Dam Data Reference card below for the full definitions.
What's "% of normal"?
The current storage value compared to the historical average storage on this calendar day. 100% = right on average; values above 100% mean above-normal storage (wet year); values below mean below-normal (dry year or drought).
Can I get alerts when storage crosses a threshold?
Yes -- alerts are managed in the Snoflo iOS app. Favorite this dam, set a threshold, and you'll get a push the moment conditions cross.
Dam data reference
Condition Assessment
- Satisfactory
- No existing or potential dam safety deficiencies are recognized. Acceptable performance is expected under all loading conditions (static, hydrologic, seismic) in accordance with the minimum applicable state or federal regulatory criteria or tolerable risk guidelines.
- Fair
- No existing dam safety deficiencies are recognized for normal operating conditions. Rare or extreme hydrologic and/or seismic events may result in a dam safety deficiency. Risk may be in the range to take further action.
- Poor
- A dam safety deficiency is recognized for normal operating conditions which may realistically occur. Remedial action is necessary. POOR may also be used when uncertainties exist as to critical analysis parameters which identify a potential dam safety deficiency.
- Unsatisfactory
- A dam safety deficiency is recognized that requires immediate or emergency remedial action for problem resolution.
- Not Rated
- The dam has not been inspected, is not under state or federal jurisdiction, or has been inspected but, for whatever reason, has not been rated.
Hazard Potential Classification
- High
- Dams assigned the high hazard potential classification are those where failure or mis-operation will probably cause loss of human life.
- Significant
- Dams assigned the significant hazard potential classification are those dams where failure or mis-operation results in no probable loss of human life but can cause economic loss, environmental damage, disruption of lifeline facilities, or impact other concerns. Significant hazard potential classification dams are often located in predominantly rural or agricultural areas but could be in areas with population and significant infrastructure.
- Low
- Dams assigned the low hazard potential classification are those where failure or mis-operation results in no probable loss of human life and low economic and/or environmental losses. Losses are principally limited to the owner's property.
- Undetermined
- Dams for which a downstream hazard potential has not been designated or is not provided.