Magnolia Shores Lake Dam

Magnolia Shores Lake
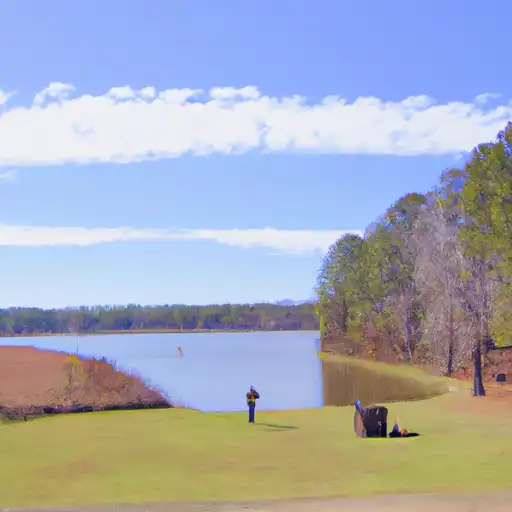
Magnolia Shores Lake, located in Crenshaw, Alabama, is a private recreational lake situated along Jordan Creek. The dam, completed in 1958, is an Earth-type structure with a hydraulic height of 27 feet and a structural height of 30 feet. With a storage capacity of 562 acre-feet and a maximum discharge of 787 cubic feet per second, the lake provides ample space for water activities and wildlife habitat.
Although the hazard potential is classified as low and the condition assessment is not rated, Magnolia Shores Lake serves as a popular spot for outdoor enthusiasts seeking a tranquil setting for fishing, boating, and picnicking. The lake's primary purpose is recreation, offering a serene escape in the heart of Alabama. Owned privately, the lake is not regulated by the state and has no associated structures or federal agency involvement.
Overall, Magnolia Shores Lake is a hidden gem in Bradleyton, Alabama, offering a peaceful retreat for those seeking to connect with nature and enjoy the beauty of the surrounding landscape. The lake's history dates back to the late 1950s, and its enduring popularity as a recreational destination underscores its importance as a water resource for the community. With its low hazard potential and unregulated status, Magnolia Shores Lake remains a pristine environment for water and climate enthusiasts to explore and appreciate.
Plan around the weather
Same NOAA / yr.no feed Snoflo's iOS app uses. Watch the precipitation column on the meteogram -- rain on the basin upstream typically lifts inflow 24-72 hours later.
Next 5 days, hour by hour
Temperature line with weather symbols on top, snow + rain accumulation as columns, humidity as a dotted line.
5-day forecast table
Every 3 hours, broken out across temperature, snow, rain, humidity, and wind. Each cell is colour-coded relative to the column min/max.
| Time | Condition | Temp (°F) | Snow (in) | Rain (in) | Humidity (%) | Wind (mps) | Wind dir |
|---|---|---|---|---|---|---|---|
| Loading detailed forecast… | |||||||
15-day temperature & precipitation
Daily temperatures, snow, and rain projected over the next two weeks.
Nearby streamflow gauges
USGS streamgauges around Magnolia Shores Lake -- inflows here typically show up in storage 24-72 hours later.
| Streamgauge | Discharge | View |
|---|---|---|
| Patsaliga Creek Near Brantley Al | 160 cfs | → |
| Conecuh River At Brantley Al | 182 cfs | → |
| Catoma Creek Near Montgomery Al | 83 cfs | → |
| Alabama River Near Montgomery | 1,700 cfs | → |
| Tallapoosa River Near Mont.-Mont. Water Works | 2,690 cfs | → |
| Pea River Near Ariton Al | 56 cfs | → |


About Magnolia Shores Lake
Where does the data for Magnolia Shores Lake come from?
Structural and regulatory data come from the U.S. Army Corps of Engineers' National Inventory of Dams (NID). Weather forecast comes from NOAA / yr.no -- the same feed Snoflo's iOS app uses.
How often is the report updated?
NID structural data refreshes annually as the Corps publishes updated assessments. The weather forecast refreshes throughout the day.
What does the Low hazard rating mean?
The Corps of Engineers' hazard potential classification grades probable consequences if the dam fails: High = probable loss of human life; Significant = no probable loss of human life but possible economic loss / environmental damage; Low = no probable loss of human life, only minor economic / environmental losses. See the Dam Data Reference card below for the full definitions.
What's "% of normal"?
The current storage value compared to the historical average storage on this calendar day. 100% = right on average; values above 100% mean above-normal storage (wet year); values below mean below-normal (dry year or drought).
Can I get alerts when storage crosses a threshold?
Yes -- alerts are managed in the Snoflo iOS app. Favorite this dam, set a threshold, and you'll get a push the moment conditions cross.
Dam data reference
Condition Assessment
- Satisfactory
- No existing or potential dam safety deficiencies are recognized. Acceptable performance is expected under all loading conditions (static, hydrologic, seismic) in accordance with the minimum applicable state or federal regulatory criteria or tolerable risk guidelines.
- Fair
- No existing dam safety deficiencies are recognized for normal operating conditions. Rare or extreme hydrologic and/or seismic events may result in a dam safety deficiency. Risk may be in the range to take further action.
- Poor
- A dam safety deficiency is recognized for normal operating conditions which may realistically occur. Remedial action is necessary. POOR may also be used when uncertainties exist as to critical analysis parameters which identify a potential dam safety deficiency.
- Unsatisfactory
- A dam safety deficiency is recognized that requires immediate or emergency remedial action for problem resolution.
- Not Rated
- The dam has not been inspected, is not under state or federal jurisdiction, or has been inspected but, for whatever reason, has not been rated.
Hazard Potential Classification
- High
- Dams assigned the high hazard potential classification are those where failure or mis-operation will probably cause loss of human life.
- Significant
- Dams assigned the significant hazard potential classification are those dams where failure or mis-operation results in no probable loss of human life but can cause economic loss, environmental damage, disruption of lifeline facilities, or impact other concerns. Significant hazard potential classification dams are often located in predominantly rural or agricultural areas but could be in areas with population and significant infrastructure.
- Low
- Dams assigned the low hazard potential classification are those where failure or mis-operation results in no probable loss of human life and low economic and/or environmental losses. Losses are principally limited to the owner's property.
- Undetermined
- Dams for which a downstream hazard potential has not been designated or is not provided.