Cedar Village Lake Dam Dam

Cedar Village Lake Dam
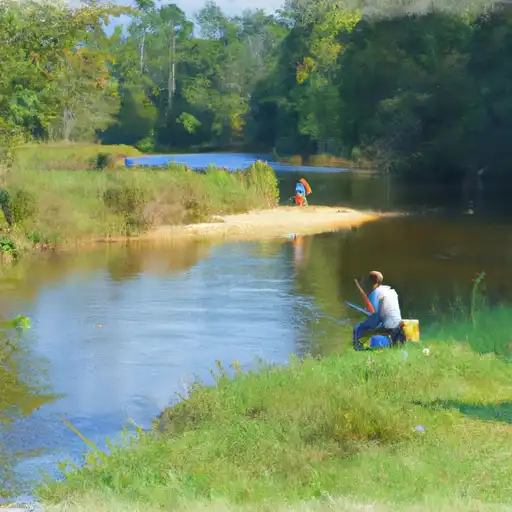
Cedar Village Lake Dam in Haywood, North Carolina, is a private dam primarily built for recreational purposes. Completed in 1965, this earth dam stands 20 feet tall with a hydraulic height of 15 feet and a length of 600 feet. It has a storage capacity of 50 acre-feet, providing a surface area of 7 acres for recreational activities such as fishing, boating, and picnicking.
Located on Cub Creek, this dam is regulated by the North Carolina Department of Environmental Quality's Dam Safety Program, ensuring regular inspections and enforcement of safety measures. Despite its fair condition assessment in 2012, the dam has a low hazard potential. The last inspection was conducted in January 2012, with a scheduled frequency of every five years. The dam poses minimal risk, making it a safe and enjoyable destination for water resource and climate enthusiasts to appreciate and explore.
With its scenic surroundings and diverse recreational opportunities, Cedar Village Lake Dam serves as a valuable asset in Chatham County. Water resource and climate enthusiasts can appreciate the beauty and functionality of this dam while also recognizing the importance of its regulatory oversight and maintenance. As a private structure designed for leisure and enjoyment, it symbolizes the harmonious balance between human activity and nature's resilience in managing water resources for both practical and recreational purposes.
Plan around the weather
Same NOAA / yr.no feed Snoflo's iOS app uses. Watch the precipitation column on the meteogram -- rain on the basin upstream typically lifts inflow 24-72 hours later.
Next 5 days, hour by hour
Temperature line with weather symbols on top, snow + rain accumulation as columns, humidity as a dotted line.
5-day forecast table
Every 3 hours, broken out across temperature, snow, rain, humidity, and wind. Each cell is colour-coded relative to the column min/max.
| Time | Condition | Temp (°F) | Snow (in) | Rain (in) | Humidity (%) | Wind (mps) | Wind dir |
|---|---|---|---|---|---|---|---|
| Loading detailed forecast… | |||||||
15-day temperature & precipitation
Daily temperatures, snow, and rain projected over the next two weeks.
Nearby streamflow gauges
USGS streamgauges around Cedar Village Lake Dam -- inflows here typically show up in storage 24-72 hours later.
| Streamgauge | Discharge | View |
|---|---|---|
| Morgan Creek Near Chapel Hill | 12 cfs | → |
| Morgan Creek Near White Cross | 0 cfs | → |
| Haw River Near Bynum | 98 cfs | → |
| New Hope Creek Near Blands | 13 cfs | → |
| Northeast Creek At Sr1100 Nr Genlee | 4 cfs | → |
| White Oak Cr At Mouth Near Green Level | · | → |


About Cedar Village Lake Dam
Where does the data for Cedar Village Lake Dam come from?
Structural and regulatory data come from the U.S. Army Corps of Engineers' National Inventory of Dams (NID). Weather forecast comes from NOAA / yr.no -- the same feed Snoflo's iOS app uses.
How often is the report updated?
NID structural data refreshes annually as the Corps publishes updated assessments. The weather forecast refreshes throughout the day.
What does the Low hazard rating mean?
The Corps of Engineers' hazard potential classification grades probable consequences if the dam fails: High = probable loss of human life; Significant = no probable loss of human life but possible economic loss / environmental damage; Low = no probable loss of human life, only minor economic / environmental losses. See the Dam Data Reference card below for the full definitions.
What's "% of normal"?
The current storage value compared to the historical average storage on this calendar day. 100% = right on average; values above 100% mean above-normal storage (wet year); values below mean below-normal (dry year or drought).
Can I get alerts when storage crosses a threshold?
Yes -- alerts are managed in the Snoflo iOS app. Favorite this dam, set a threshold, and you'll get a push the moment conditions cross.
Dam data reference
Condition Assessment
- Satisfactory
- No existing or potential dam safety deficiencies are recognized. Acceptable performance is expected under all loading conditions (static, hydrologic, seismic) in accordance with the minimum applicable state or federal regulatory criteria or tolerable risk guidelines.
- Fair
- No existing dam safety deficiencies are recognized for normal operating conditions. Rare or extreme hydrologic and/or seismic events may result in a dam safety deficiency. Risk may be in the range to take further action.
- Poor
- A dam safety deficiency is recognized for normal operating conditions which may realistically occur. Remedial action is necessary. POOR may also be used when uncertainties exist as to critical analysis parameters which identify a potential dam safety deficiency.
- Unsatisfactory
- A dam safety deficiency is recognized that requires immediate or emergency remedial action for problem resolution.
- Not Rated
- The dam has not been inspected, is not under state or federal jurisdiction, or has been inspected but, for whatever reason, has not been rated.
Hazard Potential Classification
- High
- Dams assigned the high hazard potential classification are those where failure or mis-operation will probably cause loss of human life.
- Significant
- Dams assigned the significant hazard potential classification are those dams where failure or mis-operation results in no probable loss of human life but can cause economic loss, environmental damage, disruption of lifeline facilities, or impact other concerns. Significant hazard potential classification dams are often located in predominantly rural or agricultural areas but could be in areas with population and significant infrastructure.
- Low
- Dams assigned the low hazard potential classification are those where failure or mis-operation results in no probable loss of human life and low economic and/or environmental losses. Losses are principally limited to the owner's property.
- Undetermined
- Dams for which a downstream hazard potential has not been designated or is not provided.