Fred Creek Lake Dam Dam

Fred Creek Lake Dam
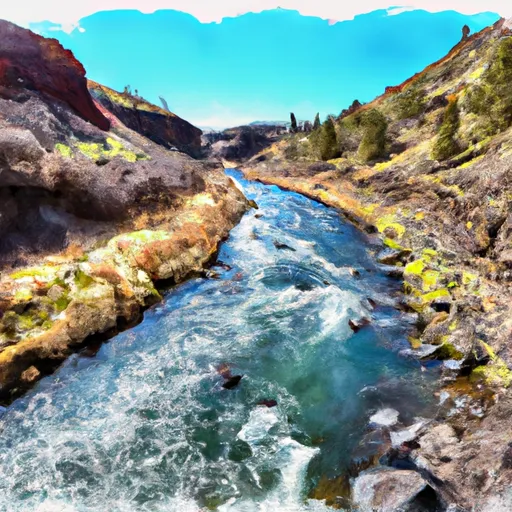
Located in Antone, Oregon, Fred Creek Lake Dam, also known as Antone Ranch Dam, was completed in 1906 with a primary purpose of serving as a fish and wildlife pond. This private dam on Fred Creek, a tributary to Rock Creek, stands at a height of 25 feet and has a length of 480 feet. With a normal storage capacity of 43 acre-feet and a surface area of 3.9 acres, the dam plays a crucial role in providing water supply and habitat for local wildlife.
Despite its age, Fred Creek Lake Dam has been regularly inspected by the Oregon Water Resources Department, with the last inspection taking place in January 2014. The dam has been deemed to have a low hazard potential and a moderate risk level. While its condition assessment is currently not rated, the dam continues to meet regulatory standards with state permitting, inspection, and enforcement in place. As a key feature in the region, the dam contributes to the conservation efforts and management of water resources in Wheeler County, Oregon.
With its earth dam type and uncontrolled spillway, Fred Creek Lake Dam serves as a vital structure for maintaining the ecological balance of the area. The dam's association with fish and wildlife ponds highlights its significance in supporting biodiversity and enhancing the natural landscape. As an integral part of the local water supply infrastructure, the dam stands as a testament to sustainable resource management practices and the importance of private ownership in stewarding water resources for future generations.
Plan around the weather
Same NOAA / yr.no feed Snoflo's iOS app uses. Watch the precipitation column on the meteogram -- rain on the basin upstream typically lifts inflow 24-72 hours later.
Next 5 days, hour by hour
Temperature line with weather symbols on top, snow + rain accumulation as columns, humidity as a dotted line.
5-day forecast table
Every 3 hours, broken out across temperature, snow, rain, humidity, and wind. Each cell is colour-coded relative to the column min/max.
| Time | Condition | Temp (°F) | Snow (in) | Rain (in) | Humidity (%) | Wind (mps) | Wind dir |
|---|---|---|---|---|---|---|---|
| Loading detailed forecast… | |||||||
15-day temperature & precipitation
Daily temperatures, snow, and rain projected over the next two weeks.
Nearby streamflow gauges
USGS streamgauges around Fred Creek Lake Dam -- inflows here typically show up in storage 24-72 hours later.
| Streamgauge | Discharge | View |
|---|---|---|
| John Day River At Service Creek | 73 cfs | → |
| Bridge Cr Abv Coyote Canyon Nr Mitchell | 0 cfs | → |
| North Fork John Day River At Monument | 77 cfs | → |
| Pine Creek Near Clarno | 8 cfs | → |
| M Fk John Day R At Ritter | 22 cfs | → |
| John Day River Near John Day | 36 cfs | → |


About Fred Creek Lake Dam
Where does the data for Fred Creek Lake Dam come from?
Structural and regulatory data come from the U.S. Army Corps of Engineers' National Inventory of Dams (NID). Weather forecast comes from NOAA / yr.no -- the same feed Snoflo's iOS app uses.
How often is the report updated?
NID structural data refreshes annually as the Corps publishes updated assessments. The weather forecast refreshes throughout the day.
What does the Low hazard rating mean?
The Corps of Engineers' hazard potential classification grades probable consequences if the dam fails: High = probable loss of human life; Significant = no probable loss of human life but possible economic loss / environmental damage; Low = no probable loss of human life, only minor economic / environmental losses. See the Dam Data Reference card below for the full definitions.
What's "% of normal"?
The current storage value compared to the historical average storage on this calendar day. 100% = right on average; values above 100% mean above-normal storage (wet year); values below mean below-normal (dry year or drought).
Can I get alerts when storage crosses a threshold?
Yes -- alerts are managed in the Snoflo iOS app. Favorite this dam, set a threshold, and you'll get a push the moment conditions cross.
Dam data reference
Condition Assessment
- Satisfactory
- No existing or potential dam safety deficiencies are recognized. Acceptable performance is expected under all loading conditions (static, hydrologic, seismic) in accordance with the minimum applicable state or federal regulatory criteria or tolerable risk guidelines.
- Fair
- No existing dam safety deficiencies are recognized for normal operating conditions. Rare or extreme hydrologic and/or seismic events may result in a dam safety deficiency. Risk may be in the range to take further action.
- Poor
- A dam safety deficiency is recognized for normal operating conditions which may realistically occur. Remedial action is necessary. POOR may also be used when uncertainties exist as to critical analysis parameters which identify a potential dam safety deficiency.
- Unsatisfactory
- A dam safety deficiency is recognized that requires immediate or emergency remedial action for problem resolution.
- Not Rated
- The dam has not been inspected, is not under state or federal jurisdiction, or has been inspected but, for whatever reason, has not been rated.
Hazard Potential Classification
- High
- Dams assigned the high hazard potential classification are those where failure or mis-operation will probably cause loss of human life.
- Significant
- Dams assigned the significant hazard potential classification are those dams where failure or mis-operation results in no probable loss of human life but can cause economic loss, environmental damage, disruption of lifeline facilities, or impact other concerns. Significant hazard potential classification dams are often located in predominantly rural or agricultural areas but could be in areas with population and significant infrastructure.
- Low
- Dams assigned the low hazard potential classification are those where failure or mis-operation results in no probable loss of human life and low economic and/or environmental losses. Losses are principally limited to the owner's property.
- Undetermined
- Dams for which a downstream hazard potential has not been designated or is not provided.