Burroughs And Chapin Dam 2 Dam

Burroughs And Chapin Dam 2
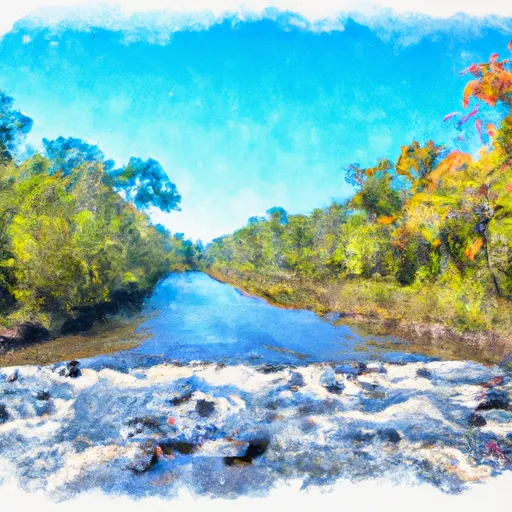
Burroughs and Chapin Dam 2, located in Horry County, South Carolina, is a privately owned earth dam built in 1950 for recreational purposes. Standing at a height of 8 feet and stretching 400 feet in length, this dam has a storage capacity of 168 acre-feet, with a normal storage of 84 acre-feet. Despite being designated as a low hazard potential structure, the dam's condition assessment is currently rated as poor, with the last inspection conducted in December 2017.
Although Burroughs and Chapin Dam 2 is not federally owned or funded, it falls under the regulatory jurisdiction of the South Carolina Department of Health and Environmental Control. This dam, situated along the TR-Atlantic Ocean stream, serves as a popular spot for recreational activities and is a key feature in Horry County's water resource infrastructure. With its location in a region susceptible to climate change impacts, the dam's maintenance and inspection are crucial to ensure public safety and the preservation of its surrounding environment.
As water resource and climate enthusiasts continue to monitor and advocate for sustainable water management practices, the condition and management of structures like Burroughs and Chapin Dam 2 play a vital role in safeguarding water resources in South Carolina. With ongoing inspections and enforcement measures in place, it is essential for stakeholders to prioritize the upkeep of this dam to mitigate any potential risks and ensure its long-term resilience in the face of changing climate patterns.
Plan around the weather
Same NOAA / yr.no feed Snoflo's iOS app uses. Watch the precipitation column on the meteogram -- rain on the basin upstream typically lifts inflow 24-72 hours later.
Next 5 days, hour by hour
Temperature line with weather symbols on top, snow + rain accumulation as columns, humidity as a dotted line.
5-day forecast table
Every 3 hours, broken out across temperature, snow, rain, humidity, and wind. Each cell is colour-coded relative to the column min/max.
| Time | Condition | Temp (°F) | Snow (in) | Rain (in) | Humidity (%) | Wind (mps) | Wind dir |
|---|---|---|---|---|---|---|---|
| Loading detailed forecast… | |||||||
15-day temperature & precipitation
Daily temperatures, snow, and rain projected over the next two weeks.
Nearby streamflow gauges
USGS streamgauges around Burroughs And Chapin Dam 2 -- inflows here typically show up in storage 24-72 hours later.
| Streamgauge | Discharge | View |
|---|---|---|
| Waccamaw River Near Longs | 15 cfs | → |
| Waccamaw River At Conway Marina At Conway | 2,260 cfs | → |
| Pee Dee River At Hwy 701 Nr Bucksport | 4,580 cfs | → |
| Waccamaw River At Freeland | 0 cfs | → |
| Little Pee Dee R. At Galivants Ferry | 171 cfs | → |
| Turkey Creek Near Maryville | 0 cfs | → |


About Burroughs And Chapin Dam 2
Where does the data for Burroughs And Chapin Dam 2 come from?
Structural and regulatory data come from the U.S. Army Corps of Engineers' National Inventory of Dams (NID). Weather forecast comes from NOAA / yr.no -- the same feed Snoflo's iOS app uses.
How often is the report updated?
NID structural data refreshes annually as the Corps publishes updated assessments. The weather forecast refreshes throughout the day.
What does the Low hazard rating mean?
The Corps of Engineers' hazard potential classification grades probable consequences if the dam fails: High = probable loss of human life; Significant = no probable loss of human life but possible economic loss / environmental damage; Low = no probable loss of human life, only minor economic / environmental losses. See the Dam Data Reference card below for the full definitions.
What's "% of normal"?
The current storage value compared to the historical average storage on this calendar day. 100% = right on average; values above 100% mean above-normal storage (wet year); values below mean below-normal (dry year or drought).
Can I get alerts when storage crosses a threshold?
Yes -- alerts are managed in the Snoflo iOS app. Favorite this dam, set a threshold, and you'll get a push the moment conditions cross.
Dam data reference
Condition Assessment
- Satisfactory
- No existing or potential dam safety deficiencies are recognized. Acceptable performance is expected under all loading conditions (static, hydrologic, seismic) in accordance with the minimum applicable state or federal regulatory criteria or tolerable risk guidelines.
- Fair
- No existing dam safety deficiencies are recognized for normal operating conditions. Rare or extreme hydrologic and/or seismic events may result in a dam safety deficiency. Risk may be in the range to take further action.
- Poor
- A dam safety deficiency is recognized for normal operating conditions which may realistically occur. Remedial action is necessary. POOR may also be used when uncertainties exist as to critical analysis parameters which identify a potential dam safety deficiency.
- Unsatisfactory
- A dam safety deficiency is recognized that requires immediate or emergency remedial action for problem resolution.
- Not Rated
- The dam has not been inspected, is not under state or federal jurisdiction, or has been inspected but, for whatever reason, has not been rated.
Hazard Potential Classification
- High
- Dams assigned the high hazard potential classification are those where failure or mis-operation will probably cause loss of human life.
- Significant
- Dams assigned the significant hazard potential classification are those dams where failure or mis-operation results in no probable loss of human life but can cause economic loss, environmental damage, disruption of lifeline facilities, or impact other concerns. Significant hazard potential classification dams are often located in predominantly rural or agricultural areas but could be in areas with population and significant infrastructure.
- Low
- Dams assigned the low hazard potential classification are those where failure or mis-operation results in no probable loss of human life and low economic and/or environmental losses. Losses are principally limited to the owner's property.
- Undetermined
- Dams for which a downstream hazard potential has not been designated or is not provided.