Carroll Thompson Dam dam

Carroll Thompson Dam
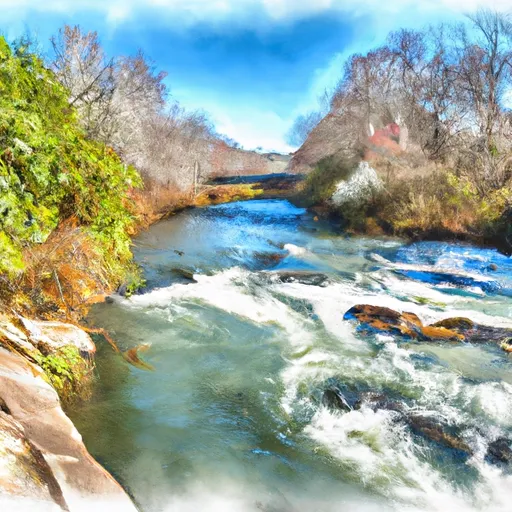
Carroll Thompson Dam in Laurens, South Carolina, stands as a testament to responsible water resource management since its completion in 1979. This private earth dam, designed by the USDA NRCS, serves the primary purpose of irrigation along the TR-Little River. With a height of 27.5 feet and a storage capacity of 102 acre-feet, the dam facilitates agricultural activities while also providing a surface area of 5.2 acres for recreational use.
Managed by the SC DHEC and classified with a low hazard potential, Carroll Thompson Dam boasts a fair condition assessment as of December 2014. With uncontrolled spillways and outlets, the dam ensures controlled water release while mitigating risks to surrounding communities. Despite being last inspected in 2014, the dam remains in moderate risk with designated emergency contacts and a 5-year inspection frequency to maintain its operational efficiency and safety standards.
Located within the jurisdiction of the Charleston District USACE, Carroll Thompson Dam represents a harmonious blend of sustainable water resource management and climate-conscious infrastructure. As a vital component of the region's irrigation system, this dam symbolizes the importance of balancing agricultural needs with environmental conservation to ensure a stable and secure water supply for future generations.
Plan around the weather
Same NOAA / yr.no feed Snoflo's iOS app uses. Watch the precipitation column on the meteogram -- rain on the basin upstream typically lifts inflow 24-72 hours later.
Next 5 days, hour by hour
Temperature line with weather symbols on top, snow + rain accumulation as columns, humidity as a dotted line.
5-day forecast table
Every 3 hours, broken out across temperature, snow, rain, humidity, and wind. Each cell is colour-coded relative to the column min/max.
| Time | Condition | Temp (°F) | Snow (in) | Rain (in) | Humidity (%) | Wind (mps) | Wind dir |
|---|---|---|---|---|---|---|---|
| Loading detailed forecast… | |||||||
15-day temperature & precipitation
Daily temperatures, snow, and rain projected over the next two weeks.
Nearby streamflow gauges
USGS streamgauges around Carroll Thompson Dam -- inflows here typically show up in storage 24-72 hours later.
| Streamgauge | Discharge | View |
|---|---|---|
| South Rabon Creek Near Gray Court | 11 cfs | → |
| Enoree River Near Woodruff | 144 cfs | → |
| Durbin Creek Above Fountain Inn | 5 cfs | → |
| Saluda River Near Ware Shoals | 775 cfs | → |
| Reedy River Above Fork Shoals | 93 cfs | → |
| Saluda River Near Williamston | 358 cfs | → |


About Carroll Thompson Dam
Where does the data for Carroll Thompson Dam come from?
Structural and regulatory data come from the U.S. Army Corps of Engineers' National Inventory of Dams (NID). Weather forecast comes from NOAA / yr.no -- the same feed Snoflo's iOS app uses.
How often is the report updated?
NID structural data refreshes annually as the Corps publishes updated assessments. The weather forecast refreshes throughout the day.
What does the Low hazard rating mean?
The Corps of Engineers' hazard potential classification grades probable consequences if the dam fails: High = probable loss of human life; Significant = no probable loss of human life but possible economic loss / environmental damage; Low = no probable loss of human life, only minor economic / environmental losses. See the Dam Data Reference card below for the full definitions.
What's "% of normal"?
The current storage value compared to the historical average storage on this calendar day. 100% = right on average; values above 100% mean above-normal storage (wet year); values below mean below-normal (dry year or drought).
Can I get alerts when storage crosses a threshold?
Yes -- alerts are managed in the Snoflo iOS app. Favorite this dam, set a threshold, and you'll get a push the moment conditions cross.
Dam data reference
Condition Assessment
- Satisfactory
- No existing or potential dam safety deficiencies are recognized. Acceptable performance is expected under all loading conditions (static, hydrologic, seismic) in accordance with the minimum applicable state or federal regulatory criteria or tolerable risk guidelines.
- Fair
- No existing dam safety deficiencies are recognized for normal operating conditions. Rare or extreme hydrologic and/or seismic events may result in a dam safety deficiency. Risk may be in the range to take further action.
- Poor
- A dam safety deficiency is recognized for normal operating conditions which may realistically occur. Remedial action is necessary. POOR may also be used when uncertainties exist as to critical analysis parameters which identify a potential dam safety deficiency.
- Unsatisfactory
- A dam safety deficiency is recognized that requires immediate or emergency remedial action for problem resolution.
- Not Rated
- The dam has not been inspected, is not under state or federal jurisdiction, or has been inspected but, for whatever reason, has not been rated.
Hazard Potential Classification
- High
- Dams assigned the high hazard potential classification are those where failure or mis-operation will probably cause loss of human life.
- Significant
- Dams assigned the significant hazard potential classification are those dams where failure or mis-operation results in no probable loss of human life but can cause economic loss, environmental damage, disruption of lifeline facilities, or impact other concerns. Significant hazard potential classification dams are often located in predominantly rural or agricultural areas but could be in areas with population and significant infrastructure.
- Low
- Dams assigned the low hazard potential classification are those where failure or mis-operation results in no probable loss of human life and low economic and/or environmental losses. Losses are principally limited to the owner's property.
- Undetermined
- Dams for which a downstream hazard potential has not been designated or is not provided.