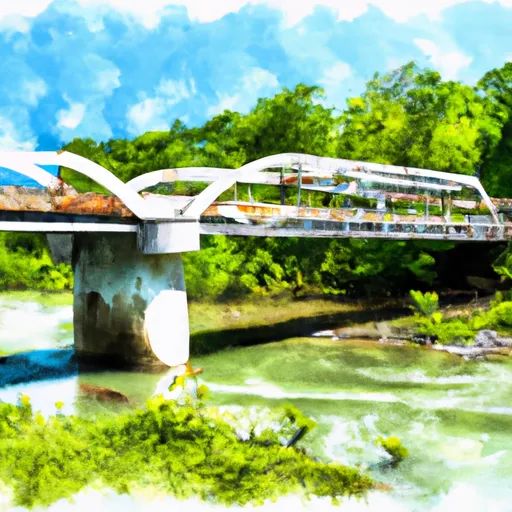
Cub Creek Lake Dam

Cub Creek Lake
Cub Creek Lake in Henderson, Tennessee, is a state-regulated water resource managed by the Tennessee Safe Dams Program. This earth dam, completed in 1937, stands at a structural height of 21.2 feet and has a hydraulic height of 16.6 feet, with a capacity to hold 736 acre-feet of water. The dam spans 475 feet in length and creates a surface area of 55 acres, utilizing the waters of Cub Creek for storage and conservation purposes.
Despite being classified as having a low hazard potential and satisfactory condition assessment, Cub Creek Lake presents a moderate risk level due to its location and potential impact on the surrounding area. The dam has been inspected regularly, with the last assessment taking place in March 2019, indicating a comprehensive risk management approach. The dam's lack of outlet gates and uncontrolled spillway type may pose challenges during high-water events, emphasizing the importance of ongoing monitoring and maintenance to ensure public safety and environmental protection.
With its picturesque setting and critical role in water resource management, Cub Creek Lake stands as a testament to Tennessee's commitment to sustainable infrastructure. Enthusiasts of water resources and climate conservation can appreciate the careful oversight and regulatory measures in place to safeguard this vital reservoir, ensuring its continued contributions to the local ecosystem and community.
Plan around the weather
Same NOAA / yr.no feed Snoflo's iOS app uses. Watch the precipitation column on the meteogram -- rain on the basin upstream typically lifts inflow 24-72 hours later.
Next 5 days, hour by hour
Temperature line with weather symbols on top, snow + rain accumulation as columns, humidity as a dotted line.
5-day forecast table
Every 3 hours, broken out across temperature, snow, rain, humidity, and wind. Each cell is colour-coded relative to the column min/max.
| Time | Condition | Temp (°F) | Snow (in) | Rain (in) | Humidity (%) | Wind (mps) | Wind dir |
|---|---|---|---|---|---|---|---|
| Loading detailed forecast… | |||||||
15-day temperature & precipitation
Daily temperatures, snow, and rain projected over the next two weeks.
Nearby streamflow gauges
USGS streamgauges around Cub Creek Lake -- inflows here typically show up in storage 24-72 hours later.
| Streamgauge | Discharge | View |
|---|---|---|
| Big Sandy River At Bruceton | 74 cfs | → |
| Cypress Creek At Camden | 10 cfs | → |
| Crooked Creek Near Huntingdon | 38 cfs | → |
| Buffalo River Below Lobelville | 1,190 cfs | → |
| Duck River Above Hurricane Mills | 2,320 cfs | → |
| Buffalo River Near Flat Woods | 701 cfs | → |


About Cub Creek Lake
Where does the data for Cub Creek Lake come from?
Structural and regulatory data come from the U.S. Army Corps of Engineers' National Inventory of Dams (NID). Weather forecast comes from NOAA / yr.no -- the same feed Snoflo's iOS app uses.
How often is the report updated?
NID structural data refreshes annually as the Corps publishes updated assessments. The weather forecast refreshes throughout the day.
What does the Low hazard rating mean?
The Corps of Engineers' hazard potential classification grades probable consequences if the dam fails: High = probable loss of human life; Significant = no probable loss of human life but possible economic loss / environmental damage; Low = no probable loss of human life, only minor economic / environmental losses. See the Dam Data Reference card below for the full definitions.
What's "% of normal"?
The current storage value compared to the historical average storage on this calendar day. 100% = right on average; values above 100% mean above-normal storage (wet year); values below mean below-normal (dry year or drought).
Can I get alerts when storage crosses a threshold?
Yes -- alerts are managed in the Snoflo iOS app. Favorite this dam, set a threshold, and you'll get a push the moment conditions cross.
Dam data reference
Condition Assessment
- Satisfactory
- No existing or potential dam safety deficiencies are recognized. Acceptable performance is expected under all loading conditions (static, hydrologic, seismic) in accordance with the minimum applicable state or federal regulatory criteria or tolerable risk guidelines.
- Fair
- No existing dam safety deficiencies are recognized for normal operating conditions. Rare or extreme hydrologic and/or seismic events may result in a dam safety deficiency. Risk may be in the range to take further action.
- Poor
- A dam safety deficiency is recognized for normal operating conditions which may realistically occur. Remedial action is necessary. POOR may also be used when uncertainties exist as to critical analysis parameters which identify a potential dam safety deficiency.
- Unsatisfactory
- A dam safety deficiency is recognized that requires immediate or emergency remedial action for problem resolution.
- Not Rated
- The dam has not been inspected, is not under state or federal jurisdiction, or has been inspected but, for whatever reason, has not been rated.
Hazard Potential Classification
- High
- Dams assigned the high hazard potential classification are those where failure or mis-operation will probably cause loss of human life.
- Significant
- Dams assigned the significant hazard potential classification are those dams where failure or mis-operation results in no probable loss of human life but can cause economic loss, environmental damage, disruption of lifeline facilities, or impact other concerns. Significant hazard potential classification dams are often located in predominantly rural or agricultural areas but could be in areas with population and significant infrastructure.
- Low
- Dams assigned the low hazard potential classification are those where failure or mis-operation results in no probable loss of human life and low economic and/or environmental losses. Losses are principally limited to the owner's property.
- Undetermined
- Dams for which a downstream hazard potential has not been designated or is not provided.