Gregory Lake Dam Dam

Gregory Lake Dam
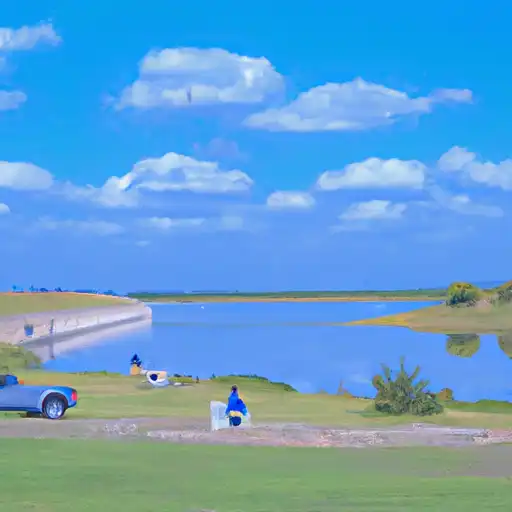
Gregory Lake Dam, located in Mitchell, Texas, was completed in 1950 and is privately owned. This Earth dam, with a height of 12 feet and a length of 1100 feet, serves a primary purpose other than flood control or water supply. It has a normal storage capacity of 250 acre-feet and a total storage capacity of 544 acre-feet, making it an essential water resource for the region.
The dam is regulated by the Texas Commission on Environmental Quality (TCEQ) and undergoes regular inspections and enforcement to ensure its structural integrity. Although the hazard potential is deemed "Not Available," the risk assessment indicates a high risk level (2). Despite the lack of a spillway, the dam has a single outlet gate. Overall, Gregory Lake Dam plays a crucial role in managing water resources in the area and mitigating potential risks associated with its operation.
For water resource and climate enthusiasts, Gregory Lake Dam represents a vital piece of infrastructure in the region. With its strategic location on Hasting Creek and its significant storage capacity, the dam contributes to water management efforts in Mitchell County, Texas. As climate change impacts water resources, the regulation and maintenance of dams like Gregory Lake Dam become increasingly important to ensure the safety and sustainability of the surrounding communities.
Plan around the weather
Same NOAA / yr.no feed Snoflo's iOS app uses. Watch the precipitation column on the meteogram -- rain on the basin upstream typically lifts inflow 24-72 hours later.
Next 5 days, hour by hour
Temperature line with weather symbols on top, snow + rain accumulation as columns, humidity as a dotted line.
5-day forecast table
Every 3 hours, broken out across temperature, snow, rain, humidity, and wind. Each cell is colour-coded relative to the column min/max.
| Time | Condition | Temp (°F) | Snow (in) | Rain (in) | Humidity (%) | Wind (mps) | Wind dir |
|---|---|---|---|---|---|---|---|
| Loading detailed forecast… | |||||||
15-day temperature & precipitation
Daily temperatures, snow, and rain projected over the next two weeks.
Nearby streamflow gauges
USGS streamgauges around Gregory Lake Dam -- inflows here typically show up in storage 24-72 hours later.
| Streamgauge | Discharge | View |
|---|---|---|
| Colorado Rv Nr Gail | 278 cfs | → |
| Colorado Rv At Colorado City | 5 cfs | → |
| Deep Ck Nr Dunn | 35 cfs | → |
| Beals Ck Nr Westbrook | 1 cfs | → |
| Colorado Rv Abv Silver | 147 cfs | → |
| N Concho Rv Abv Sterling City | · | → |


About Gregory Lake Dam
Where does the data for Gregory Lake Dam come from?
Structural and regulatory data come from the U.S. Army Corps of Engineers' National Inventory of Dams (NID). Weather forecast comes from NOAA / yr.no -- the same feed Snoflo's iOS app uses.
How often is the report updated?
NID structural data refreshes annually as the Corps publishes updated assessments. The weather forecast refreshes throughout the day.
What does the Not Available hazard rating mean?
The Corps of Engineers' hazard potential classification grades probable consequences if the dam fails: High = probable loss of human life; Significant = no probable loss of human life but possible economic loss / environmental damage; Low = no probable loss of human life, only minor economic / environmental losses. See the Dam Data Reference card below for the full definitions.
What's "% of normal"?
The current storage value compared to the historical average storage on this calendar day. 100% = right on average; values above 100% mean above-normal storage (wet year); values below mean below-normal (dry year or drought).
Can I get alerts when storage crosses a threshold?
Yes -- alerts are managed in the Snoflo iOS app. Favorite this dam, set a threshold, and you'll get a push the moment conditions cross.
Dam data reference
Condition Assessment
- Satisfactory
- No existing or potential dam safety deficiencies are recognized. Acceptable performance is expected under all loading conditions (static, hydrologic, seismic) in accordance with the minimum applicable state or federal regulatory criteria or tolerable risk guidelines.
- Fair
- No existing dam safety deficiencies are recognized for normal operating conditions. Rare or extreme hydrologic and/or seismic events may result in a dam safety deficiency. Risk may be in the range to take further action.
- Poor
- A dam safety deficiency is recognized for normal operating conditions which may realistically occur. Remedial action is necessary. POOR may also be used when uncertainties exist as to critical analysis parameters which identify a potential dam safety deficiency.
- Unsatisfactory
- A dam safety deficiency is recognized that requires immediate or emergency remedial action for problem resolution.
- Not Rated
- The dam has not been inspected, is not under state or federal jurisdiction, or has been inspected but, for whatever reason, has not been rated.
Hazard Potential Classification
- High
- Dams assigned the high hazard potential classification are those where failure or mis-operation will probably cause loss of human life.
- Significant
- Dams assigned the significant hazard potential classification are those dams where failure or mis-operation results in no probable loss of human life but can cause economic loss, environmental damage, disruption of lifeline facilities, or impact other concerns. Significant hazard potential classification dams are often located in predominantly rural or agricultural areas but could be in areas with population and significant infrastructure.
- Low
- Dams assigned the low hazard potential classification are those where failure or mis-operation results in no probable loss of human life and low economic and/or environmental losses. Losses are principally limited to the owner's property.
- Undetermined
- Dams for which a downstream hazard potential has not been designated or is not provided.