Utah County Thistle Creek Debris Dam

Utah County Thistle Creek Debris
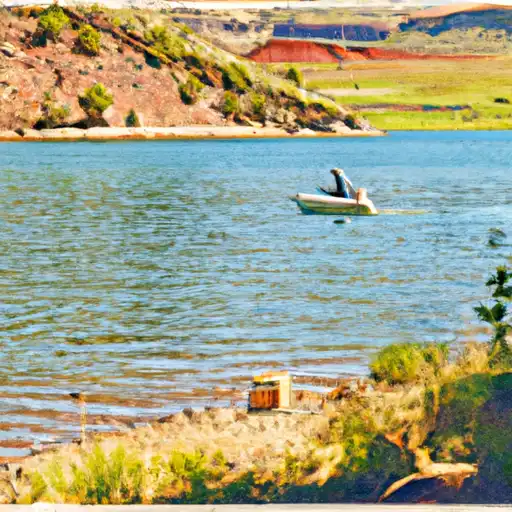
Utah County Thistle Creek Debris is a crucial structure managed by the local government of Utah to reduce flood risk in the Spanish Fork area. Completed in 1990, this earth dam stands at a hydraulic height of 11 feet and a structural height of 16 feet, with a length of 105 feet. It provides a storage capacity of 264 acre-feet, playing a vital role in flood control for the region.
Located along the Spanish Fork River, Utah County Thistle Creek Debris is regulated and permitted by the Utah Division of Water Rights, ensuring its proper inspection, enforcement, and maintenance. With a significant hazard potential but a satisfactory condition assessment, this dam serves as a key infrastructure for protecting the community from potential flooding events. It is an essential piece of the flood risk reduction strategy in the area, safeguarding the surrounding properties and livelihoods.
With a drainage area of 381 square miles and a maximum discharge of 570 cubic feet per second, the dam at Thistle Creek Debris plays a critical role in managing water flow during periods of high precipitation. It is a testament to the proactive approach taken by local authorities in Utah County to mitigate the impact of extreme weather events and protect the environment and residents from the dangers of flooding.
Plan around the weather
Same NOAA / yr.no feed Snoflo's iOS app uses. Watch the precipitation column on the meteogram -- rain on the basin upstream typically lifts inflow 24-72 hours later.
Next 5 days, hour by hour
Temperature line with weather symbols on top, snow + rain accumulation as columns, humidity as a dotted line.
5-day forecast table
Every 3 hours, broken out across temperature, snow, rain, humidity, and wind. Each cell is colour-coded relative to the column min/max.
| Time | Condition | Temp (°F) | Snow (in) | Rain (in) | Humidity (%) | Wind (mps) | Wind dir |
|---|---|---|---|---|---|---|---|
| Loading detailed forecast… | |||||||
15-day temperature & precipitation
Daily temperatures, snow, and rain projected over the next two weeks.
Nearby streamflow gauges
USGS streamgauges around Utah County Thistle Creek Debris -- inflows here typically show up in storage 24-72 hours later.
| Streamgauge | Discharge | View |
|---|---|---|
| Spanish Fork At Castilla | 332 cfs | → |
| Diamond Fork Above Red Hollow | 39 cfs | → |
| Sixth Water Cr Ab Syar Tunnel | 23 cfs | → |
| Hobble Creek At 1650 West At Springville | 16 cfs | → |
| Summit Creek Abv Summit Cr Canal Nr Santaquin Ut | 3 cfs | → |
| Provo River At Provo | 39 cfs | → |


About Utah County Thistle Creek Debris
Where does the data for Utah County Thistle Creek Debris come from?
Structural and regulatory data come from the U.S. Army Corps of Engineers' National Inventory of Dams (NID). Weather forecast comes from NOAA / yr.no -- the same feed Snoflo's iOS app uses.
How often is the report updated?
NID structural data refreshes annually as the Corps publishes updated assessments. The weather forecast refreshes throughout the day.
What does the Significant hazard rating mean?
The Corps of Engineers' hazard potential classification grades probable consequences if the dam fails: High = probable loss of human life; Significant = no probable loss of human life but possible economic loss / environmental damage; Low = no probable loss of human life, only minor economic / environmental losses. See the Dam Data Reference card below for the full definitions.
What's "% of normal"?
The current storage value compared to the historical average storage on this calendar day. 100% = right on average; values above 100% mean above-normal storage (wet year); values below mean below-normal (dry year or drought).
Can I get alerts when storage crosses a threshold?
Yes -- alerts are managed in the Snoflo iOS app. Favorite this dam, set a threshold, and you'll get a push the moment conditions cross.
Dam data reference
Condition Assessment
- Satisfactory
- No existing or potential dam safety deficiencies are recognized. Acceptable performance is expected under all loading conditions (static, hydrologic, seismic) in accordance with the minimum applicable state or federal regulatory criteria or tolerable risk guidelines.
- Fair
- No existing dam safety deficiencies are recognized for normal operating conditions. Rare or extreme hydrologic and/or seismic events may result in a dam safety deficiency. Risk may be in the range to take further action.
- Poor
- A dam safety deficiency is recognized for normal operating conditions which may realistically occur. Remedial action is necessary. POOR may also be used when uncertainties exist as to critical analysis parameters which identify a potential dam safety deficiency.
- Unsatisfactory
- A dam safety deficiency is recognized that requires immediate or emergency remedial action for problem resolution.
- Not Rated
- The dam has not been inspected, is not under state or federal jurisdiction, or has been inspected but, for whatever reason, has not been rated.
Hazard Potential Classification
- High
- Dams assigned the high hazard potential classification are those where failure or mis-operation will probably cause loss of human life.
- Significant
- Dams assigned the significant hazard potential classification are those dams where failure or mis-operation results in no probable loss of human life but can cause economic loss, environmental damage, disruption of lifeline facilities, or impact other concerns. Significant hazard potential classification dams are often located in predominantly rural or agricultural areas but could be in areas with population and significant infrastructure.
- Low
- Dams assigned the low hazard potential classification are those where failure or mis-operation results in no probable loss of human life and low economic and/or environmental losses. Losses are principally limited to the owner's property.
- Undetermined
- Dams for which a downstream hazard potential has not been designated or is not provided.