East Canyon Dam

East Canyon
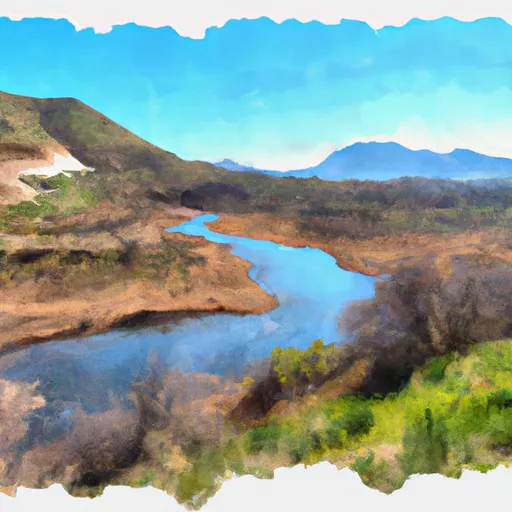
East Canyon is a concrete dam located in Portersville, Utah, along the East Canyon Creek. Built in 1965 by the Bureau of Reclamation, the dam stands at a height of 260 feet and serves multiple purposes including flood risk reduction, irrigation, and water supply. With a storage capacity of 58,350 acre-feet and a maximum discharge of 6,200 cubic feet per second, East Canyon plays a crucial role in water resource management in the region.
The dam's hazard potential is categorized as high, with a moderate risk assessment rating of 3. Despite its age, the condition assessment of East Canyon is currently listed as "Not Available," highlighting the need for regular inspection and maintenance. The Emergency Action Plan for the dam was last revised in September 2020, indicating that safety measures are in place to mitigate potential risks. Overall, East Canyon serves as a vital infrastructure for managing water resources and protecting the surrounding communities from floods in the region.
With its strategic location in Morgan County, Utah, East Canyon Dam is under the ownership and regulation of the Bureau of Reclamation. The dam's primary purpose of flood risk reduction is supported by its design as a concrete structure with arch features, standing at 260 feet in height and 436 feet in length. The dam's operation and maintenance are also overseen by the Bureau of Reclamation, ensuring its continued functionality for the irrigation, water supply, and flood control needs of the area.
Plan around the weather
Same NOAA / yr.no feed Snoflo's iOS app uses. Watch the precipitation column on the meteogram -- rain on the basin upstream typically lifts inflow 24-72 hours later.
Next 5 days, hour by hour
Temperature line with weather symbols on top, snow + rain accumulation as columns, humidity as a dotted line.
5-day forecast table
Every 3 hours, broken out across temperature, snow, rain, humidity, and wind. Each cell is colour-coded relative to the column min/max.
| Time | Condition | Temp (°F) | Snow (in) | Rain (in) | Humidity (%) | Wind (mps) | Wind dir |
|---|---|---|---|---|---|---|---|
| Loading detailed forecast… | |||||||
15-day temperature & precipitation
Daily temperatures, snow, and rain projected over the next two weeks.
Nearby streamflow gauges
USGS streamgauges around East Canyon -- inflows here typically show up in storage 24-72 hours later.
| Streamgauge | Discharge | View |
|---|---|---|
| East Canyon Creek Near Morgan | 80 cfs | → |
| East Canyon Creek Ab East Cyn Res Nr Morgan | 10 cfs | → |
| Weber River At Echo | 355 cfs | → |
| Chalk Creek At Coalville | 6 cfs | → |
| Weber River Near Coalville | 309 cfs | → |
| East Canyon Creek Near Jeremy Ranch | 4 cfs | → |


About East Canyon
Where does the data for East Canyon come from?
Structural and regulatory data come from the U.S. Army Corps of Engineers' National Inventory of Dams (NID). Weather forecast comes from NOAA / yr.no -- the same feed Snoflo's iOS app uses.
How often is the report updated?
NID structural data refreshes annually as the Corps publishes updated assessments. The weather forecast refreshes throughout the day.
What does the High hazard rating mean?
The Corps of Engineers' hazard potential classification grades probable consequences if the dam fails: High = probable loss of human life; Significant = no probable loss of human life but possible economic loss / environmental damage; Low = no probable loss of human life, only minor economic / environmental losses. See the Dam Data Reference card below for the full definitions.
What's "% of normal"?
The current storage value compared to the historical average storage on this calendar day. 100% = right on average; values above 100% mean above-normal storage (wet year); values below mean below-normal (dry year or drought).
Can I get alerts when storage crosses a threshold?
Yes -- alerts are managed in the Snoflo iOS app. Favorite this dam, set a threshold, and you'll get a push the moment conditions cross.
Dam data reference
Condition Assessment
- Satisfactory
- No existing or potential dam safety deficiencies are recognized. Acceptable performance is expected under all loading conditions (static, hydrologic, seismic) in accordance with the minimum applicable state or federal regulatory criteria or tolerable risk guidelines.
- Fair
- No existing dam safety deficiencies are recognized for normal operating conditions. Rare or extreme hydrologic and/or seismic events may result in a dam safety deficiency. Risk may be in the range to take further action.
- Poor
- A dam safety deficiency is recognized for normal operating conditions which may realistically occur. Remedial action is necessary. POOR may also be used when uncertainties exist as to critical analysis parameters which identify a potential dam safety deficiency.
- Unsatisfactory
- A dam safety deficiency is recognized that requires immediate or emergency remedial action for problem resolution.
- Not Rated
- The dam has not been inspected, is not under state or federal jurisdiction, or has been inspected but, for whatever reason, has not been rated.
Hazard Potential Classification
- High
- Dams assigned the high hazard potential classification are those where failure or mis-operation will probably cause loss of human life.
- Significant
- Dams assigned the significant hazard potential classification are those dams where failure or mis-operation results in no probable loss of human life but can cause economic loss, environmental damage, disruption of lifeline facilities, or impact other concerns. Significant hazard potential classification dams are often located in predominantly rural or agricultural areas but could be in areas with population and significant infrastructure.
- Low
- Dams assigned the low hazard potential classification are those where failure or mis-operation results in no probable loss of human life and low economic and/or environmental losses. Losses are principally limited to the owner's property.
- Undetermined
- Dams for which a downstream hazard potential has not been designated or is not provided.