Evans Flavorland Reservoir No 2 Dam

Evans Flavorland Reservoir No 2
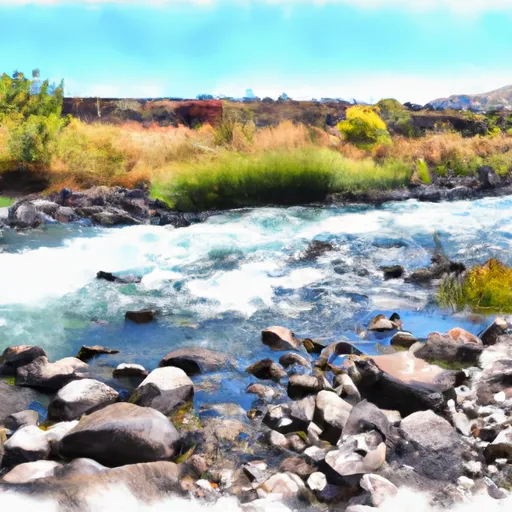
Evans Flavorland Reservoir No 2, located in Sunnyside, Washington, is a privately-owned irrigation reservoir designed by PLSA Engineers and regulated by the Washington Department of Ecology. Completed in 1998, this earth dam structure has a hydraulic height of 50 feet and a storage capacity of 140 acre-feet, primarily serving the purpose of irrigation for the surrounding agricultural area. With a normal storage capacity of 115 acre-feet and a surface area of 4.2 acres, this reservoir plays a crucial role in water resource management in the Yakima region.
Despite its satisfactory condition assessment, Evans Flavorland Reservoir No 2 has a high hazard potential, requiring regular inspections every five years to ensure its structural integrity and safety. The reservoir's maximum discharge capacity is 530 cubic feet per second, with no spillway type specified in the data. Congressional District 04, represented by Dan Newhouse, oversees this water resource along with the Seattle District of the US Army Corps of Engineers, although the reservoir itself is not owned or funded by any federal agencies. Water and climate enthusiasts interested in the management and regulation of water resources in the Yakima area will find Evans Flavorland Reservoir No 2 to be a fascinating case study in private ownership and state jurisdiction.
Plan around the weather
Same NOAA / yr.no feed Snoflo's iOS app uses. Watch the precipitation column on the meteogram -- rain on the basin upstream typically lifts inflow 24-72 hours later.
Next 5 days, hour by hour
Temperature line with weather symbols on top, snow + rain accumulation as columns, humidity as a dotted line.
5-day forecast table
Every 3 hours, broken out across temperature, snow, rain, humidity, and wind. Each cell is colour-coded relative to the column min/max.
| Time | Condition | Temp (°F) | Snow (in) | Rain (in) | Humidity (%) | Wind (mps) | Wind dir |
|---|---|---|---|---|---|---|---|
| Loading detailed forecast… | |||||||
15-day temperature & precipitation
Daily temperatures, snow, and rain projected over the next two weeks.
Nearby streamflow gauges
USGS streamgauges around Evans Flavorland Reservoir No 2 -- inflows here typically show up in storage 24-72 hours later.
| Streamgauge | Discharge | View |
|---|---|---|
| Granger Drain At Granger | 48 cfs | → |
| Yakima River At Mabton | 1,760 cfs | → |
| Columbia River Below Priest Rapids Dam | 67,800 cfs | → |
| Yakima River Above Ahtanum Creek At Union Gap | 2,730 cfs | → |
| Ahtanum Creek At Union Gap | 8 cfs | → |
| Yakima River At Kiona | 824 cfs | → |


About Evans Flavorland Reservoir No 2
Where does the data for Evans Flavorland Reservoir No 2 come from?
Structural and regulatory data come from the U.S. Army Corps of Engineers' National Inventory of Dams (NID). Weather forecast comes from NOAA / yr.no -- the same feed Snoflo's iOS app uses.
How often is the report updated?
NID structural data refreshes annually as the Corps publishes updated assessments. The weather forecast refreshes throughout the day.
What does the High hazard rating mean?
The Corps of Engineers' hazard potential classification grades probable consequences if the dam fails: High = probable loss of human life; Significant = no probable loss of human life but possible economic loss / environmental damage; Low = no probable loss of human life, only minor economic / environmental losses. See the Dam Data Reference card below for the full definitions.
What's "% of normal"?
The current storage value compared to the historical average storage on this calendar day. 100% = right on average; values above 100% mean above-normal storage (wet year); values below mean below-normal (dry year or drought).
Can I get alerts when storage crosses a threshold?
Yes -- alerts are managed in the Snoflo iOS app. Favorite this dam, set a threshold, and you'll get a push the moment conditions cross.
Dam data reference
Condition Assessment
- Satisfactory
- No existing or potential dam safety deficiencies are recognized. Acceptable performance is expected under all loading conditions (static, hydrologic, seismic) in accordance with the minimum applicable state or federal regulatory criteria or tolerable risk guidelines.
- Fair
- No existing dam safety deficiencies are recognized for normal operating conditions. Rare or extreme hydrologic and/or seismic events may result in a dam safety deficiency. Risk may be in the range to take further action.
- Poor
- A dam safety deficiency is recognized for normal operating conditions which may realistically occur. Remedial action is necessary. POOR may also be used when uncertainties exist as to critical analysis parameters which identify a potential dam safety deficiency.
- Unsatisfactory
- A dam safety deficiency is recognized that requires immediate or emergency remedial action for problem resolution.
- Not Rated
- The dam has not been inspected, is not under state or federal jurisdiction, or has been inspected but, for whatever reason, has not been rated.
Hazard Potential Classification
- High
- Dams assigned the high hazard potential classification are those where failure or mis-operation will probably cause loss of human life.
- Significant
- Dams assigned the significant hazard potential classification are those dams where failure or mis-operation results in no probable loss of human life but can cause economic loss, environmental damage, disruption of lifeline facilities, or impact other concerns. Significant hazard potential classification dams are often located in predominantly rural or agricultural areas but could be in areas with population and significant infrastructure.
- Low
- Dams assigned the low hazard potential classification are those where failure or mis-operation results in no probable loss of human life and low economic and/or environmental losses. Losses are principally limited to the owner's property.
- Undetermined
- Dams for which a downstream hazard potential has not been designated or is not provided.