Green Valley Wwtp Dam

Green Valley Wwtp
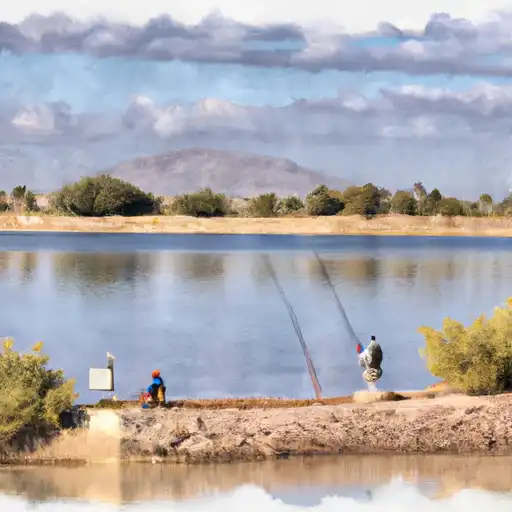
Green Valley Wastewater Treatment Plant (Green Valley WWTP) is a crucial facility owned by the local government in Tucson, Arizona, serving as a key player in the state's water resource management. This plant, located along the Santa Cruz River, is regulated and permitted by the Arizona Department of Water Resources, ensuring compliance with state regulations and enforcement measures. Completed in 1981, the plant boasts a dam height of 12.2 meters and a storage capacity of 219 acre-feet, contributing to the treatment and conservation of water in the region.
With a primary purpose designated as 'Other', Green Valley WWTP plays a vital role in the wastewater treatment process, utilizing an earth dam structure with stone core types and soil foundations. Despite being classified as a low-hazard potential facility, the plant undergoes regular inspections every five years, ensuring its efficient operation and safety. While the condition assessment remains unrated, the plant's risk assessment indicates a high level (2), prompting the need for continued risk management measures and emergency preparedness protocols.
Overall, Green Valley WWTP stands as a significant asset in the water management infrastructure of Pima County, Arizona, playing a key role in wastewater treatment and environmental protection efforts. With its strategic location and operational efficiency, the plant ensures the safe and sustainable treatment of wastewater while meeting state regulatory standards and contributing to the conservation of water resources in the region.
Plan around the weather
Same NOAA / yr.no feed Snoflo's iOS app uses. Watch the precipitation column on the meteogram -- rain on the basin upstream typically lifts inflow 24-72 hours later.
Next 5 days, hour by hour
Temperature line with weather symbols on top, snow + rain accumulation as columns, humidity as a dotted line.
5-day forecast table
Every 3 hours, broken out across temperature, snow, rain, humidity, and wind. Each cell is colour-coded relative to the column min/max.
| Time | Condition | Temp (°F) | Snow (in) | Rain (in) | Humidity (%) | Wind (mps) | Wind dir |
|---|---|---|---|---|---|---|---|
| Loading detailed forecast… | |||||||
15-day temperature & precipitation
Daily temperatures, snow, and rain projected over the next two weeks.
Nearby streamflow gauges
USGS streamgauges around Green Valley Wwtp -- inflows here typically show up in storage 24-72 hours later.
| Streamgauge | Discharge | View |
|---|---|---|
| Santa Cruz River At Continental | · | → |
| Santa Cruz Nr Amado | 0 cfs | → |
| Pantano Wash Near Vail | 3 cfs | → |
| Santa Cruz River At Tubac | · | → |
| Santa Cruz River At Tucson | · | → |
| Pantano Wash At Broadway Blvd. At Tucson | · | → |


About Green Valley Wwtp
Where does the data for Green Valley Wwtp come from?
Structural and regulatory data come from the U.S. Army Corps of Engineers' National Inventory of Dams (NID). Weather forecast comes from NOAA / yr.no -- the same feed Snoflo's iOS app uses.
How often is the report updated?
NID structural data refreshes annually as the Corps publishes updated assessments. The weather forecast refreshes throughout the day.
What does the Low hazard rating mean?
The Corps of Engineers' hazard potential classification grades probable consequences if the dam fails: High = probable loss of human life; Significant = no probable loss of human life but possible economic loss / environmental damage; Low = no probable loss of human life, only minor economic / environmental losses. See the Dam Data Reference card below for the full definitions.
What's "% of normal"?
The current storage value compared to the historical average storage on this calendar day. 100% = right on average; values above 100% mean above-normal storage (wet year); values below mean below-normal (dry year or drought).
Can I get alerts when storage crosses a threshold?
Yes -- alerts are managed in the Snoflo iOS app. Favorite this dam, set a threshold, and you'll get a push the moment conditions cross.
Dam data reference
Condition Assessment
- Satisfactory
- No existing or potential dam safety deficiencies are recognized. Acceptable performance is expected under all loading conditions (static, hydrologic, seismic) in accordance with the minimum applicable state or federal regulatory criteria or tolerable risk guidelines.
- Fair
- No existing dam safety deficiencies are recognized for normal operating conditions. Rare or extreme hydrologic and/or seismic events may result in a dam safety deficiency. Risk may be in the range to take further action.
- Poor
- A dam safety deficiency is recognized for normal operating conditions which may realistically occur. Remedial action is necessary. POOR may also be used when uncertainties exist as to critical analysis parameters which identify a potential dam safety deficiency.
- Unsatisfactory
- A dam safety deficiency is recognized that requires immediate or emergency remedial action for problem resolution.
- Not Rated
- The dam has not been inspected, is not under state or federal jurisdiction, or has been inspected but, for whatever reason, has not been rated.
Hazard Potential Classification
- High
- Dams assigned the high hazard potential classification are those where failure or mis-operation will probably cause loss of human life.
- Significant
- Dams assigned the significant hazard potential classification are those dams where failure or mis-operation results in no probable loss of human life but can cause economic loss, environmental damage, disruption of lifeline facilities, or impact other concerns. Significant hazard potential classification dams are often located in predominantly rural or agricultural areas but could be in areas with population and significant infrastructure.
- Low
- Dams assigned the low hazard potential classification are those where failure or mis-operation results in no probable loss of human life and low economic and/or environmental losses. Losses are principally limited to the owner's property.
- Undetermined
- Dams for which a downstream hazard potential has not been designated or is not provided.