Beaver Dam Dam

Beaver Dam
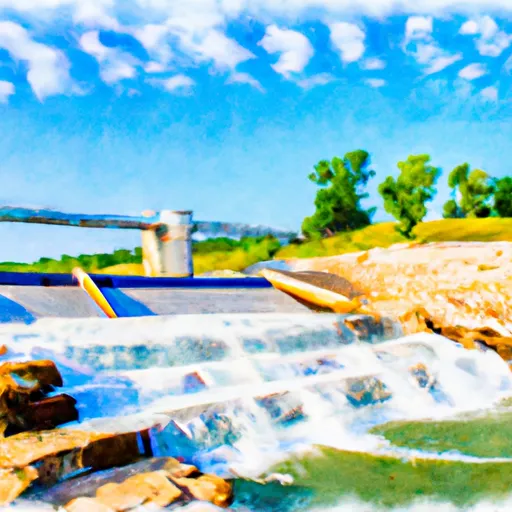
Beaver Dam, also known as Beaver Lake, is a federal-owned concrete dam located in Carroll, Arkansas. Completed in 1963, the dam stands at 228 feet high and serves multiple purposes including flood risk reduction, hydroelectric power generation, recreation, and water supply. With a storage capacity of 1,952,000 acre-feet and a surface area of 28,220 acres, Beaver Dam plays a crucial role in managing water resources in the region.
Despite being classified as having a high hazard potential, the US Army Corps of Engineers (USACE) has implemented various risk management measures to ensure the safety and integrity of Beaver Dam. These measures include ongoing inspection, maintenance, and monitoring activities, as well as the development of an Emergency Action Plan and Risk Reduction Plan. The USACE also collaborates with federal, state, and local emergency managers to conduct emergency response exercises and closely monitors rainfall forecasts to provide timely flood warnings to downstream communities.
While Beaver Dam has historically performed well in reducing flood risks, extreme rainfall events could still pose a threat to surrounding areas. USACE's proactive approach to risk management and emergency preparedness highlights their commitment to safeguarding downstream communities and ensuring the continued effectiveness of Beaver Dam in managing water resources and mitigating climate-related challenges.
Plan around the weather
Same NOAA / yr.no feed Snoflo's iOS app uses. Watch the precipitation column on the meteogram -- rain on the basin upstream typically lifts inflow 24-72 hours later.
Next 5 days, hour by hour
Temperature line with weather symbols on top, snow + rain accumulation as columns, humidity as a dotted line.
5-day forecast table
Every 3 hours, broken out across temperature, snow, rain, humidity, and wind. Each cell is colour-coded relative to the column min/max.
| Time | Condition | Temp (°F) | Snow (in) | Rain (in) | Humidity (%) | Wind (mps) | Wind dir |
|---|---|---|---|---|---|---|---|
| Loading detailed forecast… | |||||||
15-day temperature & precipitation
Daily temperatures, snow, and rain projected over the next two weeks.
Nearby streamflow gauges
USGS streamgauges around Beaver Dam -- inflows here typically show up in storage 24-72 hours later.
| Streamgauge | Discharge | View |
|---|---|---|
| Kings River Near Berryville | 164 cfs | → |
| War Eagle Creek Near Hindsville | 185 cfs | → |
| Big Sugar Creek Near Powell | 2 cfs | → |
| Osage Creek Near Cave Springs | 39 cfs | → |
| Richland Creek At Goshen | -999,999 cfs | → |
| Yocum Creek Near Oak Grove | 28 cfs | → |


About Beaver Dam
Where does the data for Beaver Dam come from?
Structural and regulatory data come from the U.S. Army Corps of Engineers' National Inventory of Dams (NID). Weather forecast comes from NOAA / yr.no -- the same feed Snoflo's iOS app uses.
How often is the report updated?
NID structural data refreshes annually as the Corps publishes updated assessments. The weather forecast refreshes throughout the day.
What does the High hazard rating mean?
The Corps of Engineers' hazard potential classification grades probable consequences if the dam fails: High = probable loss of human life; Significant = no probable loss of human life but possible economic loss / environmental damage; Low = no probable loss of human life, only minor economic / environmental losses. See the Dam Data Reference card below for the full definitions.
What's "% of normal"?
The current storage value compared to the historical average storage on this calendar day. 100% = right on average; values above 100% mean above-normal storage (wet year); values below mean below-normal (dry year or drought).
Can I get alerts when storage crosses a threshold?
Yes -- alerts are managed in the Snoflo iOS app. Favorite this dam, set a threshold, and you'll get a push the moment conditions cross.
Dam data reference
Condition Assessment
- Satisfactory
- No existing or potential dam safety deficiencies are recognized. Acceptable performance is expected under all loading conditions (static, hydrologic, seismic) in accordance with the minimum applicable state or federal regulatory criteria or tolerable risk guidelines.
- Fair
- No existing dam safety deficiencies are recognized for normal operating conditions. Rare or extreme hydrologic and/or seismic events may result in a dam safety deficiency. Risk may be in the range to take further action.
- Poor
- A dam safety deficiency is recognized for normal operating conditions which may realistically occur. Remedial action is necessary. POOR may also be used when uncertainties exist as to critical analysis parameters which identify a potential dam safety deficiency.
- Unsatisfactory
- A dam safety deficiency is recognized that requires immediate or emergency remedial action for problem resolution.
- Not Rated
- The dam has not been inspected, is not under state or federal jurisdiction, or has been inspected but, for whatever reason, has not been rated.
Hazard Potential Classification
- High
- Dams assigned the high hazard potential classification are those where failure or mis-operation will probably cause loss of human life.
- Significant
- Dams assigned the significant hazard potential classification are those dams where failure or mis-operation results in no probable loss of human life but can cause economic loss, environmental damage, disruption of lifeline facilities, or impact other concerns. Significant hazard potential classification dams are often located in predominantly rural or agricultural areas but could be in areas with population and significant infrastructure.
- Low
- Dams assigned the low hazard potential classification are those where failure or mis-operation results in no probable loss of human life and low economic and/or environmental losses. Losses are principally limited to the owner's property.
- Undetermined
- Dams for which a downstream hazard potential has not been designated or is not provided.