Davis Lake Dam

Davis Lake Dam
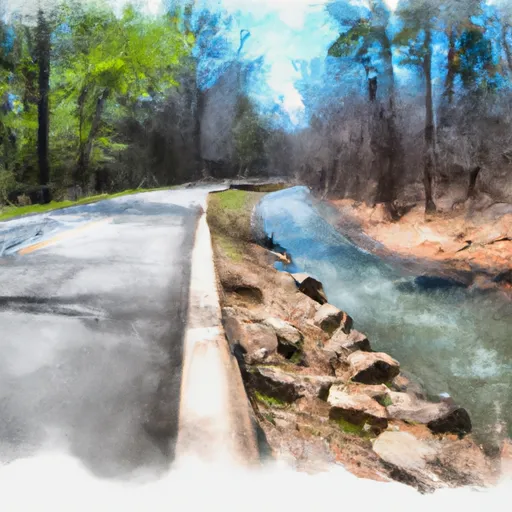
Davis Lake Dam in Lonoke, Arkansas, is a significant earth dam completed in 1972 with a height of 16 feet and a hydraulic height of 13 feet. The dam serves multiple purposes, including recreation and other uses, and has a storage capacity of 178 acre-feet. Located on Brush Creek-TR, the dam has a surface area of 11.4 acres and a drainage area of 0.18 square miles.
Despite being privately owned and not regulated by the state, Davis Lake Dam poses a significant hazard potential, although its condition assessment is currently not rated. With a maximum discharge of 467 cubic feet per second, the dam has no spillway and no outlet gates. The dam's emergency action plan status, risk assessment, and risk management measures are all currently unknown, highlighting potential areas for further study and improvement in terms of safety and environmental impact.
Water resource and climate enthusiasts interested in Davis Lake Dam will find its unique design and history intriguing. With its proximity to Memphis District and the oversight of Congressman Eric A. Crawford, the dam presents an opportunity for further research and potential improvements to ensure its long-term safety and functionality. The dam's location, primary purpose, and storage capacity make it a valuable asset for both recreational and other purposes, underscoring the importance of proper maintenance and risk management practices to protect the surrounding community and ecosystem.
Plan around the weather
Same NOAA / yr.no feed Snoflo's iOS app uses. Watch the precipitation column on the meteogram -- rain on the basin upstream typically lifts inflow 24-72 hours later.
Next 5 days, hour by hour
Temperature line with weather symbols on top, snow + rain accumulation as columns, humidity as a dotted line.
5-day forecast table
Every 3 hours, broken out across temperature, snow, rain, humidity, and wind. Each cell is colour-coded relative to the column min/max.
| Time | Condition | Temp (°F) | Snow (in) | Rain (in) | Humidity (%) | Wind (mps) | Wind dir |
|---|---|---|---|---|---|---|---|
| Loading detailed forecast… | |||||||
15-day temperature & precipitation
Daily temperatures, snow, and rain projected over the next two weeks.
Nearby streamflow gauges
USGS streamgauges around Davis Lake Dam -- inflows here typically show up in storage 24-72 hours later.
| Streamgauge | Discharge | View |
|---|---|---|
| Bayou Meto Near Lonoke | 0 cfs | → |
| White River At Georgetown | 15,000 cfs | → |
| White River At Devalls Bluff | 18,100 cfs | → |
| Rock Creek At 36th Street At Little Rock | 1 cfs | → |
| Cache River Near Cotton Plant | 751 cfs | → |
| Little Red River Near Dewey | 348 cfs | → |


About Davis Lake Dam
Where does the data for Davis Lake Dam come from?
Structural and regulatory data come from the U.S. Army Corps of Engineers' National Inventory of Dams (NID). Weather forecast comes from NOAA / yr.no -- the same feed Snoflo's iOS app uses.
How often is the report updated?
NID structural data refreshes annually as the Corps publishes updated assessments. The weather forecast refreshes throughout the day.
What does the Significant hazard rating mean?
The Corps of Engineers' hazard potential classification grades probable consequences if the dam fails: High = probable loss of human life; Significant = no probable loss of human life but possible economic loss / environmental damage; Low = no probable loss of human life, only minor economic / environmental losses. See the Dam Data Reference card below for the full definitions.
What's "% of normal"?
The current storage value compared to the historical average storage on this calendar day. 100% = right on average; values above 100% mean above-normal storage (wet year); values below mean below-normal (dry year or drought).
Can I get alerts when storage crosses a threshold?
Yes -- alerts are managed in the Snoflo iOS app. Favorite this dam, set a threshold, and you'll get a push the moment conditions cross.
Dam data reference
Condition Assessment
- Satisfactory
- No existing or potential dam safety deficiencies are recognized. Acceptable performance is expected under all loading conditions (static, hydrologic, seismic) in accordance with the minimum applicable state or federal regulatory criteria or tolerable risk guidelines.
- Fair
- No existing dam safety deficiencies are recognized for normal operating conditions. Rare or extreme hydrologic and/or seismic events may result in a dam safety deficiency. Risk may be in the range to take further action.
- Poor
- A dam safety deficiency is recognized for normal operating conditions which may realistically occur. Remedial action is necessary. POOR may also be used when uncertainties exist as to critical analysis parameters which identify a potential dam safety deficiency.
- Unsatisfactory
- A dam safety deficiency is recognized that requires immediate or emergency remedial action for problem resolution.
- Not Rated
- The dam has not been inspected, is not under state or federal jurisdiction, or has been inspected but, for whatever reason, has not been rated.
Hazard Potential Classification
- High
- Dams assigned the high hazard potential classification are those where failure or mis-operation will probably cause loss of human life.
- Significant
- Dams assigned the significant hazard potential classification are those dams where failure or mis-operation results in no probable loss of human life but can cause economic loss, environmental damage, disruption of lifeline facilities, or impact other concerns. Significant hazard potential classification dams are often located in predominantly rural or agricultural areas but could be in areas with population and significant infrastructure.
- Low
- Dams assigned the low hazard potential classification are those where failure or mis-operation results in no probable loss of human life and low economic and/or environmental losses. Losses are principally limited to the owner's property.
- Undetermined
- Dams for which a downstream hazard potential has not been designated or is not provided.