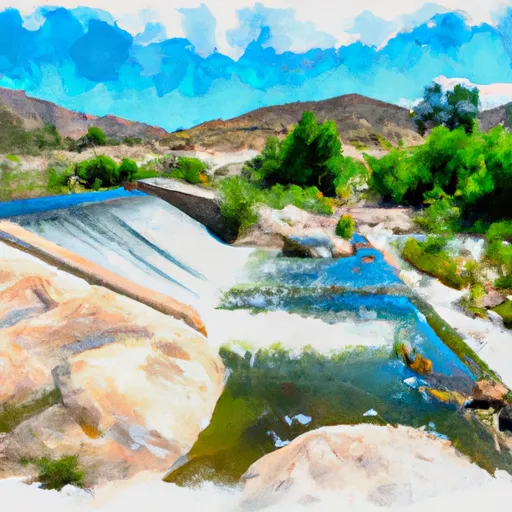
Lake Gregory Dam

Lake Gregory
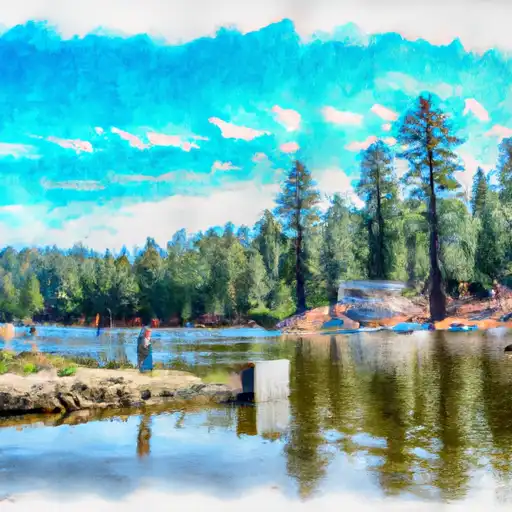
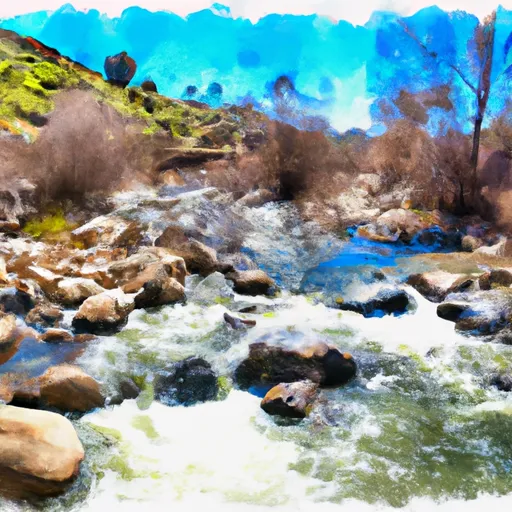
Lake Gregory, located in Crestline, California, is a picturesque water resource managed by the local government for multiple purposes including irrigation, recreation, and water supply. The dam, completed in 1938, is an earth structure standing at a height of 90 feet and with a storage capacity of 2100 acre-feet. The lake covers an area of 88 acres and is fed by Houston Creek, providing a vital source of water for the surrounding area.
Managed by the Department of Water Resources and regulated by the Safety of Dams agency, Lake Gregory plays a crucial role in the region's water management infrastructure. With a high hazard potential but deemed to be in satisfactory condition, the dam undergoes regular inspections to ensure its safety and reliability. In the event of an emergency, preparations are in place, and protocols are followed to mitigate risks and protect the surrounding community.
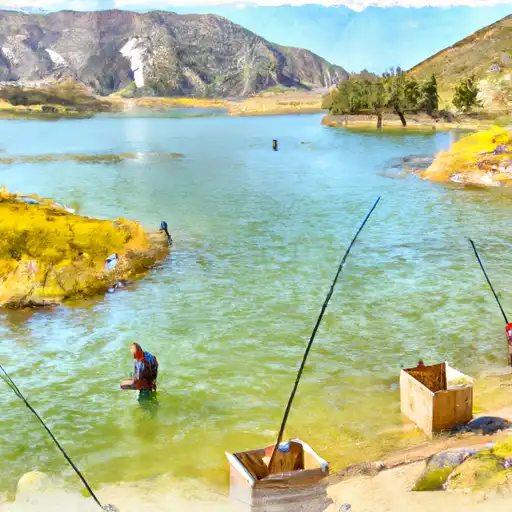
Enthusiasts of water resources and climate will appreciate Lake Gregory not only for its engineering marvel but also for its recreational opportunities and environmental significance. As a key water supply source in San Bernardino County, this reservoir serves as a vital lifeline for the region while offering a serene backdrop for outdoor activities and wildlife habitat. Visitors can enjoy boating, fishing, and hiking in this beautiful setting, all while appreciating the careful management and stewardship of this essential water resource.
Plan around the weather
Same NOAA / yr.no feed Snoflo's iOS app uses. Watch the precipitation column on the meteogram -- rain on the basin upstream typically lifts inflow 24-72 hours later.
Next 5 days, hour by hour
Temperature line with weather symbols on top, snow + rain accumulation as columns, humidity as a dotted line.
5-day forecast table
Every 3 hours, broken out across temperature, snow, rain, humidity, and wind. Each cell is colour-coded relative to the column min/max.
| Time | Condition | Temp (°F) | Snow (in) | Rain (in) | Humidity (%) | Wind (mps) | Wind dir |
|---|---|---|---|---|---|---|---|
| Loading detailed forecast… | |||||||
15-day temperature & precipitation
Daily temperatures, snow, and rain projected over the next two weeks.
Nearby streamflow gauges
USGS streamgauges around Lake Gregory -- inflows here typically show up in storage 24-72 hours later.
| Streamgauge | Discharge | View |
|---|---|---|
| Waterman Cyn C Nr Arrowhead Spgs Ca | 0 cfs | → |
| Devil Cyn C Nr San Bernardino Ca | 1 cfs | → |
| E Twin C Nr Arrowhead Springs Ca | 0 cfs | → |
| Wf Mojave R Ab Mojave R Forks Res Nr Hesperia Ca | · | → |
| Sand Canyon C Nr Highland Ca | 1 cfs | → |
| Deep C Nr Hesperia Ca | 2 cfs | → |


About Lake Gregory
Where does the data for Lake Gregory come from?
Structural and regulatory data come from the U.S. Army Corps of Engineers' National Inventory of Dams (NID). Weather forecast comes from NOAA / yr.no -- the same feed Snoflo's iOS app uses.
How often is the report updated?
NID structural data refreshes annually as the Corps publishes updated assessments. The weather forecast refreshes throughout the day.
What does the High hazard rating mean?
The Corps of Engineers' hazard potential classification grades probable consequences if the dam fails: High = probable loss of human life; Significant = no probable loss of human life but possible economic loss / environmental damage; Low = no probable loss of human life, only minor economic / environmental losses. See the Dam Data Reference card below for the full definitions.
What's "% of normal"?
The current storage value compared to the historical average storage on this calendar day. 100% = right on average; values above 100% mean above-normal storage (wet year); values below mean below-normal (dry year or drought).
Can I get alerts when storage crosses a threshold?
Yes -- alerts are managed in the Snoflo iOS app. Favorite this dam, set a threshold, and you'll get a push the moment conditions cross.
Dam data reference
Condition Assessment
- Satisfactory
- No existing or potential dam safety deficiencies are recognized. Acceptable performance is expected under all loading conditions (static, hydrologic, seismic) in accordance with the minimum applicable state or federal regulatory criteria or tolerable risk guidelines.
- Fair
- No existing dam safety deficiencies are recognized for normal operating conditions. Rare or extreme hydrologic and/or seismic events may result in a dam safety deficiency. Risk may be in the range to take further action.
- Poor
- A dam safety deficiency is recognized for normal operating conditions which may realistically occur. Remedial action is necessary. POOR may also be used when uncertainties exist as to critical analysis parameters which identify a potential dam safety deficiency.
- Unsatisfactory
- A dam safety deficiency is recognized that requires immediate or emergency remedial action for problem resolution.
- Not Rated
- The dam has not been inspected, is not under state or federal jurisdiction, or has been inspected but, for whatever reason, has not been rated.
Hazard Potential Classification
- High
- Dams assigned the high hazard potential classification are those where failure or mis-operation will probably cause loss of human life.
- Significant
- Dams assigned the significant hazard potential classification are those dams where failure or mis-operation results in no probable loss of human life but can cause economic loss, environmental damage, disruption of lifeline facilities, or impact other concerns. Significant hazard potential classification dams are often located in predominantly rural or agricultural areas but could be in areas with population and significant infrastructure.
- Low
- Dams assigned the low hazard potential classification are those where failure or mis-operation results in no probable loss of human life and low economic and/or environmental losses. Losses are principally limited to the owner's property.
- Undetermined
- Dams for which a downstream hazard potential has not been designated or is not provided.