Casa Linda Lake Dam dam

Casa Linda Lake Dam
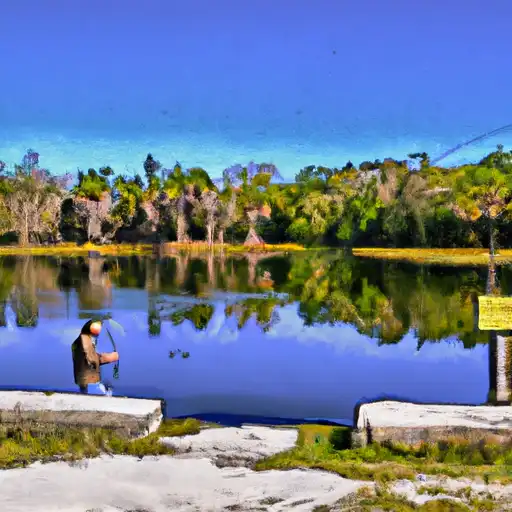
Casa Linda Lake Dam, located in Jacksonville, Florida, is a Federal-owned structure managed by the US Navy for flood risk reduction along the St. Johns River. Built in 1943, this Earth dam stands at 17 feet in height and spans 74 feet in length, with a storage capacity of 64 acre-feet. Despite its low hazard potential and fair condition assessment as of January 2019, the dam is subject to periodic inspections every 5 years to ensure its structural integrity and safety.
The dam features an uncontrolled spillway with a width of 21 feet and serves as a vital component in managing water levels and mitigating flood risks in the area. While the dam has not been modified in recent years, it continues to play a crucial role in protecting the surrounding community from potential inundation. With its moderate risk assessment rating of 3, Casa Linda Lake Dam underscores the importance of ongoing monitoring and risk management measures to safeguard against potential hazards and ensure the resilience of the water resource infrastructure.
Water resource and climate enthusiasts will find Casa Linda Lake Dam to be a fascinating example of Federal stewardship in flood risk reduction efforts. As a key structure along the St. Johns River, this dam highlights the collaborative efforts of the US Navy in ensuring the safety and security of local communities through effective water management strategies. With its strategic location and historical significance dating back to the 1940s, Casa Linda Lake Dam serves as a testament to the enduring importance of sustainable water resource practices in the face of changing climate conditions.
Plan around the weather
Same NOAA / yr.no feed Snoflo's iOS app uses. Watch the precipitation column on the meteogram -- rain on the basin upstream typically lifts inflow 24-72 hours later.
Next 5 days, hour by hour
Temperature line with weather symbols on top, snow + rain accumulation as columns, humidity as a dotted line.
5-day forecast table
Every 3 hours, broken out across temperature, snow, rain, humidity, and wind. Each cell is colour-coded relative to the column min/max.
| Time | Condition | Temp (°F) | Snow (in) | Rain (in) | Humidity (%) | Wind (mps) | Wind dir |
|---|---|---|---|---|---|---|---|
| Loading detailed forecast… | |||||||
15-day temperature & precipitation
Daily temperatures, snow, and rain projected over the next two weeks.
Nearby streamflow gauges
USGS streamgauges around Casa Linda Lake Dam -- inflows here typically show up in storage 24-72 hours later.
| Streamgauge | Discharge | View |
|---|---|---|
| Ortega River At Kirwin Rd Nr Jacksonville | 7 cfs | → |
| Cedar River At San Juan Ave At Jacksonville | 341 cfs | → |
| Pottsburg Creek Nr South Jacksonville | 72 cfs | → |
| St. Johns River At Jacksonville | 191,000 cfs | → |
| Julington Crk At Old St August Rd Nr Bayard | 39 cfs | → |
| North Fork Black Creek Nr Middleburg | 27 cfs | → |
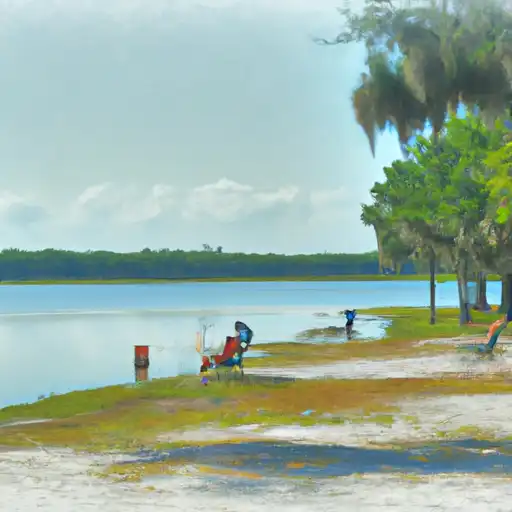
Make a day of it
Boat launches, lakeside camping, fishing access, and other reservoirs near Casa Linda Lake Dam.
Boat launches
See all →


Campgrounds
See all →


Fishing spots
See all →


River runs
See all →


About Casa Linda Lake Dam
Where does the data for Casa Linda Lake Dam come from?
Structural and regulatory data come from the U.S. Army Corps of Engineers' National Inventory of Dams (NID). Weather forecast comes from NOAA / yr.no -- the same feed Snoflo's iOS app uses.
How often is the report updated?
NID structural data refreshes annually as the Corps publishes updated assessments. The weather forecast refreshes throughout the day.
What does the Low hazard rating mean?
The Corps of Engineers' hazard potential classification grades probable consequences if the dam fails: High = probable loss of human life; Significant = no probable loss of human life but possible economic loss / environmental damage; Low = no probable loss of human life, only minor economic / environmental losses. See the Dam Data Reference card below for the full definitions.
What's "% of normal"?
The current storage value compared to the historical average storage on this calendar day. 100% = right on average; values above 100% mean above-normal storage (wet year); values below mean below-normal (dry year or drought).
Can I get alerts when storage crosses a threshold?
Yes -- alerts are managed in the Snoflo iOS app. Favorite this dam, set a threshold, and you'll get a push the moment conditions cross.
Dam data reference
Condition Assessment
- Satisfactory
- No existing or potential dam safety deficiencies are recognized. Acceptable performance is expected under all loading conditions (static, hydrologic, seismic) in accordance with the minimum applicable state or federal regulatory criteria or tolerable risk guidelines.
- Fair
- No existing dam safety deficiencies are recognized for normal operating conditions. Rare or extreme hydrologic and/or seismic events may result in a dam safety deficiency. Risk may be in the range to take further action.
- Poor
- A dam safety deficiency is recognized for normal operating conditions which may realistically occur. Remedial action is necessary. POOR may also be used when uncertainties exist as to critical analysis parameters which identify a potential dam safety deficiency.
- Unsatisfactory
- A dam safety deficiency is recognized that requires immediate or emergency remedial action for problem resolution.
- Not Rated
- The dam has not been inspected, is not under state or federal jurisdiction, or has been inspected but, for whatever reason, has not been rated.
Hazard Potential Classification
- High
- Dams assigned the high hazard potential classification are those where failure or mis-operation will probably cause loss of human life.
- Significant
- Dams assigned the significant hazard potential classification are those dams where failure or mis-operation results in no probable loss of human life but can cause economic loss, environmental damage, disruption of lifeline facilities, or impact other concerns. Significant hazard potential classification dams are often located in predominantly rural or agricultural areas but could be in areas with population and significant infrastructure.
- Low
- Dams assigned the low hazard potential classification are those where failure or mis-operation results in no probable loss of human life and low economic and/or environmental losses. Losses are principally limited to the owner's property.
- Undetermined
- Dams for which a downstream hazard potential has not been designated or is not provided.