Ware Lake Dam Dam

Ware Lake Dam
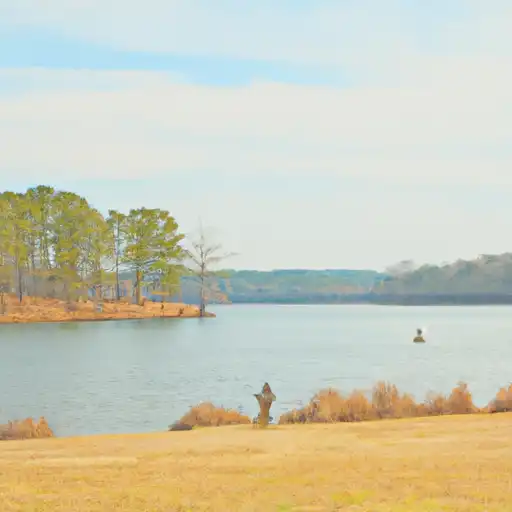
Ware Lake Dam is a privately owned structure located in Coweta, Georgia, along Sandy Creek. Built in 1955, this earth dam stands at a height of 17.6 feet and serves primarily for recreational purposes, offering a serene environment for visitors to enjoy water activities. With a maximum storage capacity of 91.6 acre-feet and a normal storage level of 58 acre-feet, Ware Lake Dam provides a picturesque setting with a surface area of 8.3 acres.
Although the dam has an uncontrolled spillway and outlet gates, its hazard potential is rated as low, with a moderate risk assessment score of 3. Even though it is not regulated by the state and has not been inspected or rated for condition, Ware Lake Dam remains a popular spot for outdoor enthusiasts seeking a peaceful retreat near Newnan. With its historical significance and beautiful surroundings, the dam continues to attract visitors interested in water resources and climate-related activities in the area.
Overall, Ware Lake Dam offers a unique blend of recreational opportunities and natural beauty, making it a noteworthy destination for water resource and climate enthusiasts in Georgia. Despite its age, lack of state regulation, and unknown inspection status, the dam's low hazard potential and moderate risk assessment suggest that it remains a safe and enjoyable location for those looking to explore the intersection of water management and environmental conservation.
Plan around the weather
Same NOAA / yr.no feed Snoflo's iOS app uses. Watch the precipitation column on the meteogram -- rain on the basin upstream typically lifts inflow 24-72 hours later.
Next 5 days, hour by hour
Temperature line with weather symbols on top, snow + rain accumulation as columns, humidity as a dotted line.
5-day forecast table
Every 3 hours, broken out across temperature, snow, rain, humidity, and wind. Each cell is colour-coded relative to the column min/max.
| Time | Condition | Temp (°F) | Snow (in) | Rain (in) | Humidity (%) | Wind (mps) | Wind dir |
|---|---|---|---|---|---|---|---|
| Loading detailed forecast… | |||||||
15-day temperature & precipitation
Daily temperatures, snow, and rain projected over the next two weeks.
Nearby streamflow gauges
USGS streamgauges around Ware Lake Dam -- inflows here typically show up in storage 24-72 hours later.
| Streamgauge | Discharge | View |
|---|---|---|
| New River At Ga 100 | 23 cfs | → |
| Chattahoochee River Near Whitesburg | 1,830 cfs | → |
| Chattahoochee River At Us 27 | 2,430 cfs | → |
| Snake Creek Near Whitesburg | 10 cfs | → |
| Yellowjacket Cr At Hammett Rd Blw Hogansville | 17 cfs | → |
| Line Creek Near Senoia | 13 cfs | → |


About Ware Lake Dam
Where does the data for Ware Lake Dam come from?
Structural and regulatory data come from the U.S. Army Corps of Engineers' National Inventory of Dams (NID). Weather forecast comes from NOAA / yr.no -- the same feed Snoflo's iOS app uses.
How often is the report updated?
NID structural data refreshes annually as the Corps publishes updated assessments. The weather forecast refreshes throughout the day.
What does the Low hazard rating mean?
The Corps of Engineers' hazard potential classification grades probable consequences if the dam fails: High = probable loss of human life; Significant = no probable loss of human life but possible economic loss / environmental damage; Low = no probable loss of human life, only minor economic / environmental losses. See the Dam Data Reference card below for the full definitions.
What's "% of normal"?
The current storage value compared to the historical average storage on this calendar day. 100% = right on average; values above 100% mean above-normal storage (wet year); values below mean below-normal (dry year or drought).
Can I get alerts when storage crosses a threshold?
Yes -- alerts are managed in the Snoflo iOS app. Favorite this dam, set a threshold, and you'll get a push the moment conditions cross.
Dam data reference
Condition Assessment
- Satisfactory
- No existing or potential dam safety deficiencies are recognized. Acceptable performance is expected under all loading conditions (static, hydrologic, seismic) in accordance with the minimum applicable state or federal regulatory criteria or tolerable risk guidelines.
- Fair
- No existing dam safety deficiencies are recognized for normal operating conditions. Rare or extreme hydrologic and/or seismic events may result in a dam safety deficiency. Risk may be in the range to take further action.
- Poor
- A dam safety deficiency is recognized for normal operating conditions which may realistically occur. Remedial action is necessary. POOR may also be used when uncertainties exist as to critical analysis parameters which identify a potential dam safety deficiency.
- Unsatisfactory
- A dam safety deficiency is recognized that requires immediate or emergency remedial action for problem resolution.
- Not Rated
- The dam has not been inspected, is not under state or federal jurisdiction, or has been inspected but, for whatever reason, has not been rated.
Hazard Potential Classification
- High
- Dams assigned the high hazard potential classification are those where failure or mis-operation will probably cause loss of human life.
- Significant
- Dams assigned the significant hazard potential classification are those dams where failure or mis-operation results in no probable loss of human life but can cause economic loss, environmental damage, disruption of lifeline facilities, or impact other concerns. Significant hazard potential classification dams are often located in predominantly rural or agricultural areas but could be in areas with population and significant infrastructure.
- Low
- Dams assigned the low hazard potential classification are those where failure or mis-operation results in no probable loss of human life and low economic and/or environmental losses. Losses are principally limited to the owner's property.
- Undetermined
- Dams for which a downstream hazard potential has not been designated or is not provided.