Buffalo River Dam

Buffalo River
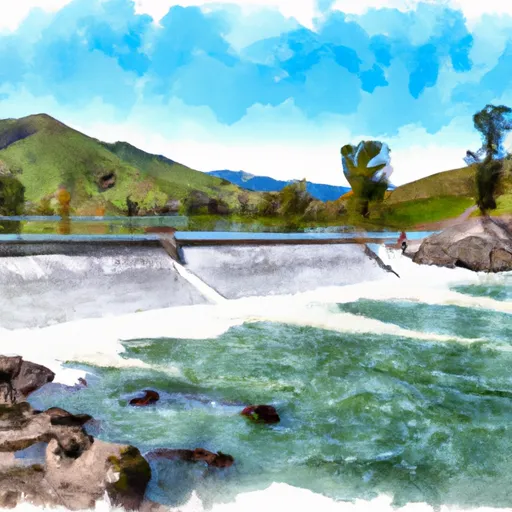
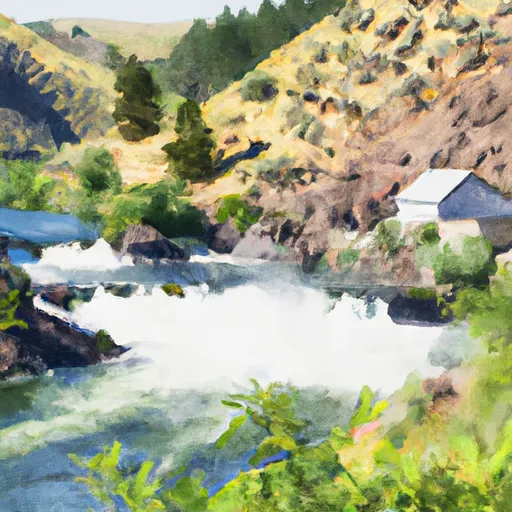
Buffalo River, located in Fremont, Idaho, is a private hydroelectric facility with a dam that was completed in 1936. The dam has a height of 10 feet and a structural height of 12 feet, with a length of 142 feet. The reservoir created by the dam has a storage capacity of 60 acre-feet, with a normal storage level of 50 acre-feet. The dam is primarily used for hydroelectric purposes and is regulated by the Federal Energy Regulatory Commission.
The Buffalo River dam has a low hazard potential and is classified as having a very high risk, with a risk level of 1. The dam has a controlled spillway with a width of 40 feet and a maximum discharge capacity of 500 cubic feet per second. Despite its age, the dam's condition assessment is currently listed as "Not Available," and the last inspection took place in June 2017. Emergency action plans are in place, with the last revision made in December 2020.
Overall, Buffalo River is a significant hydroelectric resource in Idaho, providing clean energy and water management capabilities. While it has a low hazard potential, the dam is considered to have a high risk level, necessitating careful monitoring and preparedness measures. The facility's historical importance and ongoing operational significance make it a crucial component of the region's water resource and climate management infrastructure.
Plan around the weather
Same NOAA / yr.no feed Snoflo's iOS app uses. Watch the precipitation column on the meteogram -- rain on the basin upstream typically lifts inflow 24-72 hours later.
Next 5 days, hour by hour
Temperature line with weather symbols on top, snow + rain accumulation as columns, humidity as a dotted line.
5-day forecast table
Every 3 hours, broken out across temperature, snow, rain, humidity, and wind. Each cell is colour-coded relative to the column min/max.
| Time | Condition | Temp (°F) | Snow (in) | Rain (in) | Humidity (%) | Wind (mps) | Wind dir |
|---|---|---|---|---|---|---|---|
| Loading detailed forecast… | |||||||
15-day temperature & precipitation
Daily temperatures, snow, and rain projected over the next two weeks.
Nearby streamflow gauges
USGS streamgauges around Buffalo River -- inflows here typically show up in storage 24-72 hours later.
| Streamgauge | Discharge | View |
|---|---|---|
| Henrys Fork Nr Island Park Id | 1,610 cfs | → |
| Henrys Fork Blw Coffee Pot Rapids Nr Macks Inn Id | 372 cfs | → |
| Big Springs At Big Springs Id | 128 cfs | → |
| Henrys Fork Nr Lake Id | 200 cfs | → |
| Red Rock Cr Ab Lakes Nr Lakeview Mt | 35 cfs | → |
| Madison River Near West Yellowstone Mt | 322 cfs | → |


About Buffalo River
Where does the data for Buffalo River come from?
Structural and regulatory data come from the U.S. Army Corps of Engineers' National Inventory of Dams (NID). Weather forecast comes from NOAA / yr.no -- the same feed Snoflo's iOS app uses.
How often is the report updated?
NID structural data refreshes annually as the Corps publishes updated assessments. The weather forecast refreshes throughout the day.
What does the Low hazard rating mean?
The Corps of Engineers' hazard potential classification grades probable consequences if the dam fails: High = probable loss of human life; Significant = no probable loss of human life but possible economic loss / environmental damage; Low = no probable loss of human life, only minor economic / environmental losses. See the Dam Data Reference card below for the full definitions.
What's "% of normal"?
The current storage value compared to the historical average storage on this calendar day. 100% = right on average; values above 100% mean above-normal storage (wet year); values below mean below-normal (dry year or drought).
Can I get alerts when storage crosses a threshold?
Yes -- alerts are managed in the Snoflo iOS app. Favorite this dam, set a threshold, and you'll get a push the moment conditions cross.
Dam data reference
Condition Assessment
- Satisfactory
- No existing or potential dam safety deficiencies are recognized. Acceptable performance is expected under all loading conditions (static, hydrologic, seismic) in accordance with the minimum applicable state or federal regulatory criteria or tolerable risk guidelines.
- Fair
- No existing dam safety deficiencies are recognized for normal operating conditions. Rare or extreme hydrologic and/or seismic events may result in a dam safety deficiency. Risk may be in the range to take further action.
- Poor
- A dam safety deficiency is recognized for normal operating conditions which may realistically occur. Remedial action is necessary. POOR may also be used when uncertainties exist as to critical analysis parameters which identify a potential dam safety deficiency.
- Unsatisfactory
- A dam safety deficiency is recognized that requires immediate or emergency remedial action for problem resolution.
- Not Rated
- The dam has not been inspected, is not under state or federal jurisdiction, or has been inspected but, for whatever reason, has not been rated.
Hazard Potential Classification
- High
- Dams assigned the high hazard potential classification are those where failure or mis-operation will probably cause loss of human life.
- Significant
- Dams assigned the significant hazard potential classification are those dams where failure or mis-operation results in no probable loss of human life but can cause economic loss, environmental damage, disruption of lifeline facilities, or impact other concerns. Significant hazard potential classification dams are often located in predominantly rural or agricultural areas but could be in areas with population and significant infrastructure.
- Low
- Dams assigned the low hazard potential classification are those where failure or mis-operation results in no probable loss of human life and low economic and/or environmental losses. Losses are principally limited to the owner's property.
- Undetermined
- Dams for which a downstream hazard potential has not been designated or is not provided.