Jones Canyon Dam

Jones Canyon Dam
Jones Canyon Dam, located in Washoe, Nevada, stands as a Federal-owned structure along the Jones Canyon Creek. The dam serves primarily for irrigation purposes, with a storage capacity of 50 acre-feet and a surface area of 3 acres. Standing at a height of 43 feet and a length of 500 feet, the dam's design is classified as an Earth dam with a stone core and soil foundation. Despite its low hazard potential, the dam's condition assessment is rated as poor, emphasizing the need for maintenance and inspection.
Managed by the Nevada Department of Water Resources, Jones Canyon Dam remains under state regulation, with inspections conducted every five years. The dam's spillway type is uncontrolled, with a width of 20 feet, and an outlet gate consisting of a single slide or sluice gate. While the dam's risk assessment is moderate, with a risk level of 3, no Emergency Action Plan (EAP) has been prepared to date, highlighting a potential area for improvement in emergency preparedness and risk management measures.
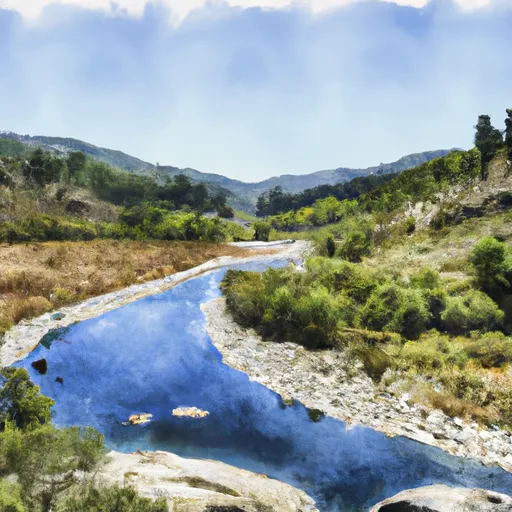
Situated in a picturesque location near Nixon, Nevada, Jones Canyon Dam plays a crucial role in water resource management and irrigation in the region. As a vital infrastructure for agricultural activities and fire protection, the dam's maintenance and upkeep are essential to ensure its continued functionality and safety for the surrounding community. Climate and water resource enthusiasts are encouraged to monitor updates on Jones Canyon Dam's condition and regulatory compliance to support sustainable water management practices in the area.
Plan around the weather
Same NOAA / yr.no feed Snoflo's iOS app uses. Watch the precipitation column on the meteogram -- rain on the basin upstream typically lifts inflow 24-72 hours later.
Next 5 days, hour by hour
Temperature line with weather symbols on top, snow + rain accumulation as columns, humidity as a dotted line.
5-day forecast table
Every 3 hours, broken out across temperature, snow, rain, humidity, and wind. Each cell is colour-coded relative to the column min/max.
| Time | Condition | Temp (°F) | Snow (in) | Rain (in) | Humidity (%) | Wind (mps) | Wind dir |
|---|---|---|---|---|---|---|---|
| Loading detailed forecast… | |||||||
15-day temperature & precipitation
Daily temperatures, snow, and rain projected over the next two weeks.
Nearby streamflow gauges
USGS streamgauges around Jones Canyon Dam -- inflows here typically show up in storage 24-72 hours later.
| Streamgauge | Discharge | View |
|---|---|---|
| Truckee R Nr Nixon | 169 cfs | → |
| Truckee R At Wadsworth | 149 cfs | → |
| Truckee Ca Nr Wadsworth | 125 cfs | → |
| Truckee R Bl Derby Dam Nr Wadsworth | 208 cfs | → |
| Truckee River Nr Tracy | 165 cfs | → |
| N Truckee Drain At Spanish Springs Rd Nr Sparks Nv | 3 cfs | → |


About Jones Canyon Dam
Where does the data for Jones Canyon Dam come from?
Structural and regulatory data come from the U.S. Army Corps of Engineers' National Inventory of Dams (NID). Weather forecast comes from NOAA / yr.no -- the same feed Snoflo's iOS app uses.
How often is the report updated?
NID structural data refreshes annually as the Corps publishes updated assessments. The weather forecast refreshes throughout the day.
What does the Low hazard rating mean?
The Corps of Engineers' hazard potential classification grades probable consequences if the dam fails: High = probable loss of human life; Significant = no probable loss of human life but possible economic loss / environmental damage; Low = no probable loss of human life, only minor economic / environmental losses. See the Dam Data Reference card below for the full definitions.
What's "% of normal"?
The current storage value compared to the historical average storage on this calendar day. 100% = right on average; values above 100% mean above-normal storage (wet year); values below mean below-normal (dry year or drought).
Can I get alerts when storage crosses a threshold?
Yes -- alerts are managed in the Snoflo iOS app. Favorite this dam, set a threshold, and you'll get a push the moment conditions cross.
Dam data reference
Condition Assessment
- Satisfactory
- No existing or potential dam safety deficiencies are recognized. Acceptable performance is expected under all loading conditions (static, hydrologic, seismic) in accordance with the minimum applicable state or federal regulatory criteria or tolerable risk guidelines.
- Fair
- No existing dam safety deficiencies are recognized for normal operating conditions. Rare or extreme hydrologic and/or seismic events may result in a dam safety deficiency. Risk may be in the range to take further action.
- Poor
- A dam safety deficiency is recognized for normal operating conditions which may realistically occur. Remedial action is necessary. POOR may also be used when uncertainties exist as to critical analysis parameters which identify a potential dam safety deficiency.
- Unsatisfactory
- A dam safety deficiency is recognized that requires immediate or emergency remedial action for problem resolution.
- Not Rated
- The dam has not been inspected, is not under state or federal jurisdiction, or has been inspected but, for whatever reason, has not been rated.
Hazard Potential Classification
- High
- Dams assigned the high hazard potential classification are those where failure or mis-operation will probably cause loss of human life.
- Significant
- Dams assigned the significant hazard potential classification are those dams where failure or mis-operation results in no probable loss of human life but can cause economic loss, environmental damage, disruption of lifeline facilities, or impact other concerns. Significant hazard potential classification dams are often located in predominantly rural or agricultural areas but could be in areas with population and significant infrastructure.
- Low
- Dams assigned the low hazard potential classification are those where failure or mis-operation results in no probable loss of human life and low economic and/or environmental losses. Losses are principally limited to the owner's property.
- Undetermined
- Dams for which a downstream hazard potential has not been designated or is not provided.