Buckhorn Lake Dam Dam

Buckhorn Lake Dam
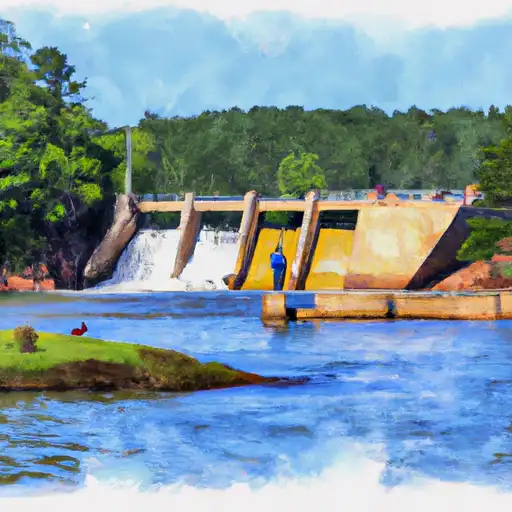
Buckhorn Lake Dam, located in Lee County, North Carolina, was completed in 1915 and serves as a critical water resource for the region. Managed by a public utility, this earth dam stands at a height of 31 feet with a hydraulic height of 10 feet, providing essential water supply and recreational opportunities for the community. Situated on the Cape Fear River, the dam has a maximum storage capacity of 4,000 acre-feet and a normal storage level of 1,760 acre-feet, supporting the needs of the surrounding area.
Despite its age, Buckhorn Lake Dam has been well-maintained with a satisfactory condition assessment as of June 2016. With a low hazard potential, the dam is regularly inspected every five years to ensure its safety and functionality. The dam is also regulated by the North Carolina Dam Safety Program, underscoring the commitment to maintaining its structural integrity and mitigating any potential risks. As a key component of the water infrastructure in the region, Buckhorn Lake Dam plays a vital role in water supply management and recreational activities, contributing to the overall well-being of the community.
In addition to its role in water resource management, Buckhorn Lake Dam offers recreational opportunities for residents and visitors alike. With a surface area of 1,550 feet and a drainage area of 2,048,000 square feet, the dam provides a picturesque setting for activities such as boating, fishing, and wildlife observation. The dam's location in Lillington, North Carolina, combined with its proximity to the Cape Fear River, makes it a popular destination for outdoor enthusiasts seeking to connect with nature and enjoy the beauty of the region's waterways.
Plan around the weather
Same NOAA / yr.no feed Snoflo's iOS app uses. Watch the precipitation column on the meteogram -- rain on the basin upstream typically lifts inflow 24-72 hours later.
Next 5 days, hour by hour
Temperature line with weather symbols on top, snow + rain accumulation as columns, humidity as a dotted line.
5-day forecast table
Every 3 hours, broken out across temperature, snow, rain, humidity, and wind. Each cell is colour-coded relative to the column min/max.
| Time | Condition | Temp (°F) | Snow (in) | Rain (in) | Humidity (%) | Wind (mps) | Wind dir |
|---|---|---|---|---|---|---|---|
| Loading detailed forecast… | |||||||
15-day temperature & precipitation
Daily temperatures, snow, and rain projected over the next two weeks.
Nearby streamflow gauges
USGS streamgauges around Buckhorn Lake Dam -- inflows here typically show up in storage 24-72 hours later.
| Streamgauge | Discharge | View |
|---|---|---|
| Buckhorn Creek Nr Corinth | 0 cfs | → |
| Deep River At Moncure | 102 cfs | → |
| Cape Fear River At Lillington | 246 cfs | → |
| White Oak Cr At Mouth Near Green Level | · | → |
| Haw River Near Bynum | 88 cfs | → |
| Swift Creek Near Apex | 26 cfs | → |


About Buckhorn Lake Dam
Where does the data for Buckhorn Lake Dam come from?
Structural and regulatory data come from the U.S. Army Corps of Engineers' National Inventory of Dams (NID). Weather forecast comes from NOAA / yr.no -- the same feed Snoflo's iOS app uses.
How often is the report updated?
NID structural data refreshes annually as the Corps publishes updated assessments. The weather forecast refreshes throughout the day.
What does the Low hazard rating mean?
The Corps of Engineers' hazard potential classification grades probable consequences if the dam fails: High = probable loss of human life; Significant = no probable loss of human life but possible economic loss / environmental damage; Low = no probable loss of human life, only minor economic / environmental losses. See the Dam Data Reference card below for the full definitions.
What's "% of normal"?
The current storage value compared to the historical average storage on this calendar day. 100% = right on average; values above 100% mean above-normal storage (wet year); values below mean below-normal (dry year or drought).
Can I get alerts when storage crosses a threshold?
Yes -- alerts are managed in the Snoflo iOS app. Favorite this dam, set a threshold, and you'll get a push the moment conditions cross.
Dam data reference
Condition Assessment
- Satisfactory
- No existing or potential dam safety deficiencies are recognized. Acceptable performance is expected under all loading conditions (static, hydrologic, seismic) in accordance with the minimum applicable state or federal regulatory criteria or tolerable risk guidelines.
- Fair
- No existing dam safety deficiencies are recognized for normal operating conditions. Rare or extreme hydrologic and/or seismic events may result in a dam safety deficiency. Risk may be in the range to take further action.
- Poor
- A dam safety deficiency is recognized for normal operating conditions which may realistically occur. Remedial action is necessary. POOR may also be used when uncertainties exist as to critical analysis parameters which identify a potential dam safety deficiency.
- Unsatisfactory
- A dam safety deficiency is recognized that requires immediate or emergency remedial action for problem resolution.
- Not Rated
- The dam has not been inspected, is not under state or federal jurisdiction, or has been inspected but, for whatever reason, has not been rated.
Hazard Potential Classification
- High
- Dams assigned the high hazard potential classification are those where failure or mis-operation will probably cause loss of human life.
- Significant
- Dams assigned the significant hazard potential classification are those dams where failure or mis-operation results in no probable loss of human life but can cause economic loss, environmental damage, disruption of lifeline facilities, or impact other concerns. Significant hazard potential classification dams are often located in predominantly rural or agricultural areas but could be in areas with population and significant infrastructure.
- Low
- Dams assigned the low hazard potential classification are those where failure or mis-operation results in no probable loss of human life and low economic and/or environmental losses. Losses are principally limited to the owner's property.
- Undetermined
- Dams for which a downstream hazard potential has not been designated or is not provided.