Watson Lake Dam dam

Watson Lake Dam
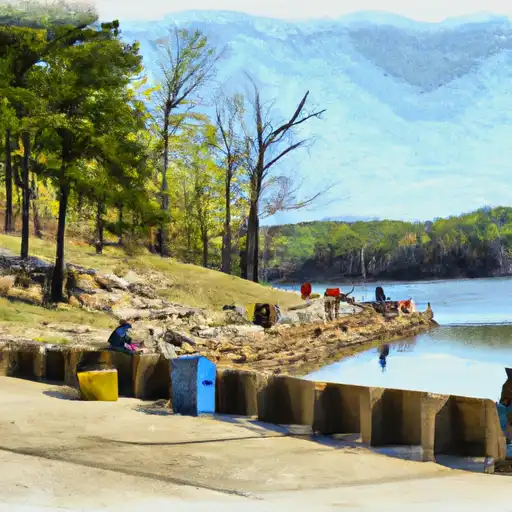
Watson Lake Dam, located in Caulksville, Arkansas, along Dry Fork Creek, was completed in 1954 by the USDA NRCS. This private dam serves primarily for flood risk reduction, but also supports recreation and water supply purposes. Standing at a hydraulic height of 11 feet and a structural height of 16 feet, Watson Lake Dam has a storage capacity of 224 acre-feet, with a maximum discharge of 10,060 cubic feet per second.
Despite being a private structure with low hazard potential, Watson Lake Dam has not been rated for its condition assessment. The dam does not fall under state jurisdiction and is not regulated or inspected by state authorities. The dam is managed by the Natural Resources Conservation Service and is part of the Little Rock District, with Congressman Bruce Westerman representing the area. While the dam has not been modified in recent years, it is essential for flood control in the region and contributes to the local water management system.
Overall, Watson Lake Dam plays a crucial role in managing water resources in Logan County, Arkansas. With its strategic location along Dry Fork Creek, the dam provides flood protection, recreational opportunities, and water supply benefits to the community. As an earth-type dam, Watson Lake Dam stands as a testament to efficient water infrastructure design and management, ensuring the safety and well-being of residents in the region.
Plan around the weather
Same NOAA / yr.no feed Snoflo's iOS app uses. Watch the precipitation column on the meteogram -- rain on the basin upstream typically lifts inflow 24-72 hours later.
Next 5 days, hour by hour
Temperature line with weather symbols on top, snow + rain accumulation as columns, humidity as a dotted line.
5-day forecast table
Every 3 hours, broken out across temperature, snow, rain, humidity, and wind. Each cell is colour-coded relative to the column min/max.
| Time | Condition | Temp (°F) | Snow (in) | Rain (in) | Humidity (%) | Wind (mps) | Wind dir |
|---|---|---|---|---|---|---|---|
| Loading detailed forecast… | |||||||
15-day temperature & precipitation
Daily temperatures, snow, and rain projected over the next two weeks.
Nearby streamflow gauges
USGS streamgauges around Watson Lake Dam -- inflows here typically show up in storage 24-72 hours later.
| Streamgauge | Discharge | View |
|---|---|---|
| Petit Jean River Near Booneville | 18 cfs | → |
| Dutch Creek At Waltreak | · | → |
| Mulberry River Near Mulberry. Ar | 208 cfs | → |
| James Fork Near Hackett | 13 cfs | → |
| Fourche Lafave River Near Gravelly | 37 cfs | → |
| Petit Jean River At Danville | 342 cfs | → |


About Watson Lake Dam
Where does the data for Watson Lake Dam come from?
Structural and regulatory data come from the U.S. Army Corps of Engineers' National Inventory of Dams (NID). Weather forecast comes from NOAA / yr.no -- the same feed Snoflo's iOS app uses.
How often is the report updated?
NID structural data refreshes annually as the Corps publishes updated assessments. The weather forecast refreshes throughout the day.
What does the Low hazard rating mean?
The Corps of Engineers' hazard potential classification grades probable consequences if the dam fails: High = probable loss of human life; Significant = no probable loss of human life but possible economic loss / environmental damage; Low = no probable loss of human life, only minor economic / environmental losses. See the Dam Data Reference card below for the full definitions.
What's "% of normal"?
The current storage value compared to the historical average storage on this calendar day. 100% = right on average; values above 100% mean above-normal storage (wet year); values below mean below-normal (dry year or drought).
Can I get alerts when storage crosses a threshold?
Yes -- alerts are managed in the Snoflo iOS app. Favorite this dam, set a threshold, and you'll get a push the moment conditions cross.
Dam data reference
Condition Assessment
- Satisfactory
- No existing or potential dam safety deficiencies are recognized. Acceptable performance is expected under all loading conditions (static, hydrologic, seismic) in accordance with the minimum applicable state or federal regulatory criteria or tolerable risk guidelines.
- Fair
- No existing dam safety deficiencies are recognized for normal operating conditions. Rare or extreme hydrologic and/or seismic events may result in a dam safety deficiency. Risk may be in the range to take further action.
- Poor
- A dam safety deficiency is recognized for normal operating conditions which may realistically occur. Remedial action is necessary. POOR may also be used when uncertainties exist as to critical analysis parameters which identify a potential dam safety deficiency.
- Unsatisfactory
- A dam safety deficiency is recognized that requires immediate or emergency remedial action for problem resolution.
- Not Rated
- The dam has not been inspected, is not under state or federal jurisdiction, or has been inspected but, for whatever reason, has not been rated.
Hazard Potential Classification
- High
- Dams assigned the high hazard potential classification are those where failure or mis-operation will probably cause loss of human life.
- Significant
- Dams assigned the significant hazard potential classification are those dams where failure or mis-operation results in no probable loss of human life but can cause economic loss, environmental damage, disruption of lifeline facilities, or impact other concerns. Significant hazard potential classification dams are often located in predominantly rural or agricultural areas but could be in areas with population and significant infrastructure.
- Low
- Dams assigned the low hazard potential classification are those where failure or mis-operation results in no probable loss of human life and low economic and/or environmental losses. Losses are principally limited to the owner's property.
- Undetermined
- Dams for which a downstream hazard potential has not been designated or is not provided.