Carolina Living Dam Dam

Carolina Living Dam
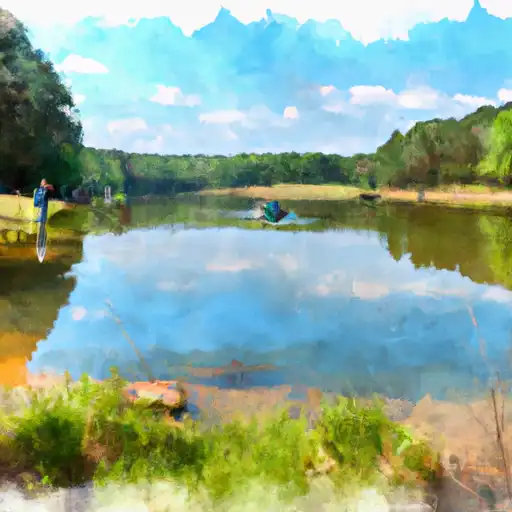
Carolina Living Dam, located in Lexington, South Carolina, is a privately owned structure that serves primarily for recreational purposes. This earth dam, with a height of 18 feet and a length of 220 feet, creates a reservoir with a storage capacity of 92 acre-feet. Situated on Bull Swamp Creek, the dam offers a serene setting for outdoor enthusiasts to enjoy activities such as fishing, boating, and wildlife observation.
Despite its low hazard potential, the dam's condition assessment is rated as poor, indicating a need for maintenance and possible upgrades to ensure its long-term stability. The last inspection in 2017 revealed this concerning assessment, highlighting the importance of regular monitoring and upkeep to mitigate any potential risks associated with the structure. With its proximity to Joe Wilson's congressional district and the Savannah District of the US Army Corps of Engineers, Carolina Living Dam lies at the intersection of regulatory oversight and community engagement in water resource management.
As water resource and climate enthusiasts, staying informed about the state of dams like Carolina Living Dam is crucial for understanding the challenges and opportunities in ensuring the safety and sustainability of our water infrastructure. By advocating for proper maintenance, inspection, and risk management measures for structures like Carolina Living Dam, we can contribute to the resilience of our water resources and the communities that rely on them.
Plan around the weather
Same NOAA / yr.no feed Snoflo's iOS app uses. Watch the precipitation column on the meteogram -- rain on the basin upstream typically lifts inflow 24-72 hours later.
Next 5 days, hour by hour
Temperature line with weather symbols on top, snow + rain accumulation as columns, humidity as a dotted line.
5-day forecast table
Every 3 hours, broken out across temperature, snow, rain, humidity, and wind. Each cell is colour-coded relative to the column min/max.
| Time | Condition | Temp (°F) | Snow (in) | Rain (in) | Humidity (%) | Wind (mps) | Wind dir |
|---|---|---|---|---|---|---|---|
| Loading detailed forecast… | |||||||
15-day temperature & precipitation
Daily temperatures, snow, and rain projected over the next two weeks.
Nearby streamflow gauges
USGS streamgauges around Carolina Living Dam -- inflows here typically show up in storage 24-72 hours later.
| Streamgauge | Discharge | View |
|---|---|---|
| Congaree River At Columbia | 3,750 cfs | → |
| Saluda River Near Columbia | 861 cfs | → |
| Gills Creek At Columbia | 59 cfs | → |
| Smith Branch At North Main St At Columbia | 2 cfs | → |
| Saluda River Below Lk Murray Dam Nr Columbia | 770 cfs | → |
| North Fork Edisto River At Orangeburg | 389 cfs | → |


About Carolina Living Dam
Where does the data for Carolina Living Dam come from?
Structural and regulatory data come from the U.S. Army Corps of Engineers' National Inventory of Dams (NID). Weather forecast comes from NOAA / yr.no -- the same feed Snoflo's iOS app uses.
How often is the report updated?
NID structural data refreshes annually as the Corps publishes updated assessments. The weather forecast refreshes throughout the day.
What does the Low hazard rating mean?
The Corps of Engineers' hazard potential classification grades probable consequences if the dam fails: High = probable loss of human life; Significant = no probable loss of human life but possible economic loss / environmental damage; Low = no probable loss of human life, only minor economic / environmental losses. See the Dam Data Reference card below for the full definitions.
What's "% of normal"?
The current storage value compared to the historical average storage on this calendar day. 100% = right on average; values above 100% mean above-normal storage (wet year); values below mean below-normal (dry year or drought).
Can I get alerts when storage crosses a threshold?
Yes -- alerts are managed in the Snoflo iOS app. Favorite this dam, set a threshold, and you'll get a push the moment conditions cross.
Dam data reference
Condition Assessment
- Satisfactory
- No existing or potential dam safety deficiencies are recognized. Acceptable performance is expected under all loading conditions (static, hydrologic, seismic) in accordance with the minimum applicable state or federal regulatory criteria or tolerable risk guidelines.
- Fair
- No existing dam safety deficiencies are recognized for normal operating conditions. Rare or extreme hydrologic and/or seismic events may result in a dam safety deficiency. Risk may be in the range to take further action.
- Poor
- A dam safety deficiency is recognized for normal operating conditions which may realistically occur. Remedial action is necessary. POOR may also be used when uncertainties exist as to critical analysis parameters which identify a potential dam safety deficiency.
- Unsatisfactory
- A dam safety deficiency is recognized that requires immediate or emergency remedial action for problem resolution.
- Not Rated
- The dam has not been inspected, is not under state or federal jurisdiction, or has been inspected but, for whatever reason, has not been rated.
Hazard Potential Classification
- High
- Dams assigned the high hazard potential classification are those where failure or mis-operation will probably cause loss of human life.
- Significant
- Dams assigned the significant hazard potential classification are those dams where failure or mis-operation results in no probable loss of human life but can cause economic loss, environmental damage, disruption of lifeline facilities, or impact other concerns. Significant hazard potential classification dams are often located in predominantly rural or agricultural areas but could be in areas with population and significant infrastructure.
- Low
- Dams assigned the low hazard potential classification are those where failure or mis-operation results in no probable loss of human life and low economic and/or environmental losses. Losses are principally limited to the owner's property.
- Undetermined
- Dams for which a downstream hazard potential has not been designated or is not provided.