Center Point Lake Dam Dam

Center Point Lake Dam
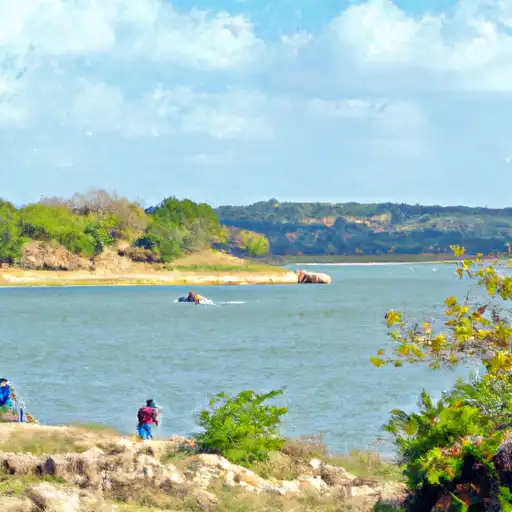
Center Point Lake Dam, located in Kerr County, Texas, stands as a crucial structure along the Guadalupe River, serving primarily for flood risk reduction. Built in 1956 by designer George L Dahl, this concrete buttress dam stands at a height of 15 feet, with a structural height of 18 feet and a length of 282 feet. The dam has a storage capacity of 87 acre-feet, providing essential flood control and recreation opportunities for the region.
Managed by the local government and regulated by the Texas Commission on Environmental Quality (TCEQ), Center Point Lake Dam has been assessed to be in fair condition as of August 2017. With a moderate risk level of 3, the dam has a spillway width of 75 feet and is equipped with outlet gates for water release. Despite its relatively small surface area of 16.7 acres, the dam plays a vital role in protecting the surrounding area from potential flooding events and ensuring the safety of nearby communities.
Visitors and water resource enthusiasts can appreciate the engineering marvel of Center Point Lake Dam while enjoying the recreational activities it offers. From fishing and boating to simply basking in the serene surroundings, this dam not only serves a critical function in flood protection but also provides a picturesque setting for outdoor enjoyment in the heart of Texas Hill Country.
Plan around the weather
Same NOAA / yr.no feed Snoflo's iOS app uses. Watch the precipitation column on the meteogram -- rain on the basin upstream typically lifts inflow 24-72 hours later.
Next 5 days, hour by hour
Temperature line with weather symbols on top, snow + rain accumulation as columns, humidity as a dotted line.
5-day forecast table
Every 3 hours, broken out across temperature, snow, rain, humidity, and wind. Each cell is colour-coded relative to the column min/max.
| Time | Condition | Temp (°F) | Snow (in) | Rain (in) | Humidity (%) | Wind (mps) | Wind dir |
|---|---|---|---|---|---|---|---|
| Loading detailed forecast… | |||||||
15-day temperature & precipitation
Daily temperatures, snow, and rain projected over the next two weeks.
Nearby streamflow gauges
USGS streamgauges around Center Point Lake Dam -- inflows here typically show up in storage 24-72 hours later.
| Streamgauge | Discharge | View |
|---|---|---|
| Guadalupe Rv Nr Center Point | 585 cfs | → |
| Guadalupe Rv At Comfort | 14,500 cfs | → |
| Guadalupe Rv At Kerrville | 5,710 cfs | → |
| Guadalupe Rv Abv Bear Ck At Kerrville | 390 cfs | → |
| Medina Rv At Bandera | 2,680 cfs | → |
| Johnson Ck Nr Ingram | 95,900 cfs | → |


About Center Point Lake Dam
Where does the data for Center Point Lake Dam come from?
Structural and regulatory data come from the U.S. Army Corps of Engineers' National Inventory of Dams (NID). Weather forecast comes from NOAA / yr.no -- the same feed Snoflo's iOS app uses.
How often is the report updated?
NID structural data refreshes annually as the Corps publishes updated assessments. The weather forecast refreshes throughout the day.
What does the Not Available hazard rating mean?
The Corps of Engineers' hazard potential classification grades probable consequences if the dam fails: High = probable loss of human life; Significant = no probable loss of human life but possible economic loss / environmental damage; Low = no probable loss of human life, only minor economic / environmental losses. See the Dam Data Reference card below for the full definitions.
What's "% of normal"?
The current storage value compared to the historical average storage on this calendar day. 100% = right on average; values above 100% mean above-normal storage (wet year); values below mean below-normal (dry year or drought).
Can I get alerts when storage crosses a threshold?
Yes -- alerts are managed in the Snoflo iOS app. Favorite this dam, set a threshold, and you'll get a push the moment conditions cross.
Dam data reference
Condition Assessment
- Satisfactory
- No existing or potential dam safety deficiencies are recognized. Acceptable performance is expected under all loading conditions (static, hydrologic, seismic) in accordance with the minimum applicable state or federal regulatory criteria or tolerable risk guidelines.
- Fair
- No existing dam safety deficiencies are recognized for normal operating conditions. Rare or extreme hydrologic and/or seismic events may result in a dam safety deficiency. Risk may be in the range to take further action.
- Poor
- A dam safety deficiency is recognized for normal operating conditions which may realistically occur. Remedial action is necessary. POOR may also be used when uncertainties exist as to critical analysis parameters which identify a potential dam safety deficiency.
- Unsatisfactory
- A dam safety deficiency is recognized that requires immediate or emergency remedial action for problem resolution.
- Not Rated
- The dam has not been inspected, is not under state or federal jurisdiction, or has been inspected but, for whatever reason, has not been rated.
Hazard Potential Classification
- High
- Dams assigned the high hazard potential classification are those where failure or mis-operation will probably cause loss of human life.
- Significant
- Dams assigned the significant hazard potential classification are those dams where failure or mis-operation results in no probable loss of human life but can cause economic loss, environmental damage, disruption of lifeline facilities, or impact other concerns. Significant hazard potential classification dams are often located in predominantly rural or agricultural areas but could be in areas with population and significant infrastructure.
- Low
- Dams assigned the low hazard potential classification are those where failure or mis-operation results in no probable loss of human life and low economic and/or environmental losses. Losses are principally limited to the owner's property.
- Undetermined
- Dams for which a downstream hazard potential has not been designated or is not provided.