Tdcj Ferguson Unit Dam Dam

Tdcj Ferguson Unit Dam
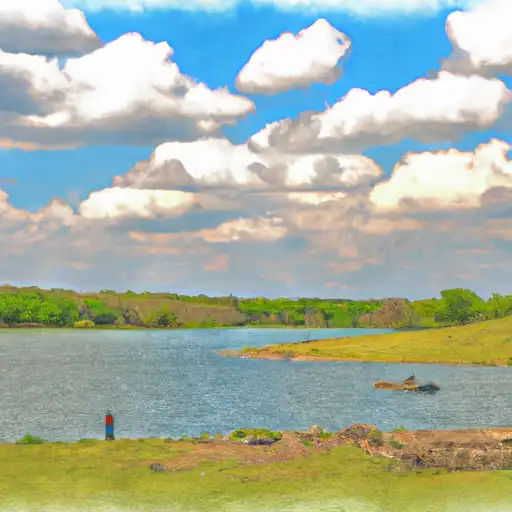
Located in Trinity, Texas, the Tdcj Ferguson Unit Dam stands as a testament to efficient water resource management and climate resilience. Built in 1965 by the USDA NRCS, this Earth-type dam serves primarily for irrigation purposes, showcasing a height of 13 feet and a length of 6000 feet. With a storage capacity of 650 acre-feet and a maximum discharge rate of 0, this dam plays a crucial role in maintaining water resources for the surrounding area.
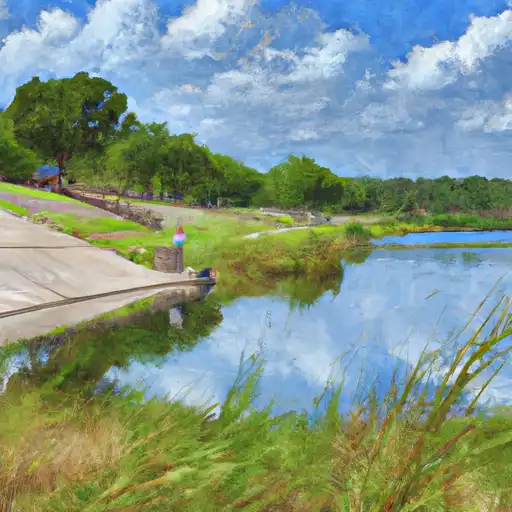
Managed by the Texas Commission on Environmental Quality (TCEQ), the Tdcj Ferguson Unit Dam is subject to regular inspections and enforcement measures to ensure its structural integrity and safety. Despite being rated as "Not Available" in terms of hazard potential and condition assessment, this dam remains a vital component of the local water infrastructure, contributing to the overall risk assessment of the region. With the absence of a spillway and lock system, this dam relies on its design and construction to effectively manage water flow and storage.
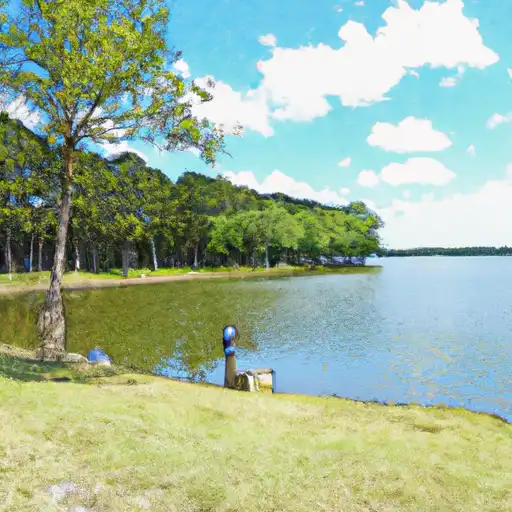
Amidst evolving climate patterns and increasing water demand, the Tdcj Ferguson Unit Dam serves as a vital lifeline for irrigation activities in the area. With its strategic location off the Trinity River and under the jurisdiction of the state of Texas, this dam symbolizes the interconnectedness of water resources, climate factors, and sustainable infrastructure development. As water enthusiasts and climate advocates, the significance of this dam cannot be understated in the broader context of water management and climate resilience efforts.
Plan around the weather
Same NOAA / yr.no feed Snoflo's iOS app uses. Watch the precipitation column on the meteogram -- rain on the basin upstream typically lifts inflow 24-72 hours later.
Next 5 days, hour by hour
Temperature line with weather symbols on top, snow + rain accumulation as columns, humidity as a dotted line.
5-day forecast table
Every 3 hours, broken out across temperature, snow, rain, humidity, and wind. Each cell is colour-coded relative to the column min/max.
| Time | Condition | Temp (°F) | Snow (in) | Rain (in) | Humidity (%) | Wind (mps) | Wind dir |
|---|---|---|---|---|---|---|---|
| Loading detailed forecast… | |||||||
15-day temperature & precipitation
Daily temperatures, snow, and rain projected over the next two weeks.
Nearby streamflow gauges
USGS streamgauges around Tdcj Ferguson Unit Dam -- inflows here typically show up in storage 24-72 hours later.
| Streamgauge | Discharge | View |
|---|---|---|
| Bedias Ck Nr Madisonville | 27 cfs | → |
| W Fk San Jacinto Rv Nr Huntsville | 16 cfs | → |
| Trinity Rv Nr Crockett | 5,560 cfs | → |
| Navasota Rv At Old Spanish Rd Nr Bryan | 90 cfs | → |
| Kickapoo Ck At Onalaska | 3 cfs | → |
| Navasota Rv Nr Easterly | 41 cfs | → |


About Tdcj Ferguson Unit Dam
Where does the data for Tdcj Ferguson Unit Dam come from?
Structural and regulatory data come from the U.S. Army Corps of Engineers' National Inventory of Dams (NID). Weather forecast comes from NOAA / yr.no -- the same feed Snoflo's iOS app uses.
How often is the report updated?
NID structural data refreshes annually as the Corps publishes updated assessments. The weather forecast refreshes throughout the day.
What does the Not Available hazard rating mean?
The Corps of Engineers' hazard potential classification grades probable consequences if the dam fails: High = probable loss of human life; Significant = no probable loss of human life but possible economic loss / environmental damage; Low = no probable loss of human life, only minor economic / environmental losses. See the Dam Data Reference card below for the full definitions.
What's "% of normal"?
The current storage value compared to the historical average storage on this calendar day. 100% = right on average; values above 100% mean above-normal storage (wet year); values below mean below-normal (dry year or drought).
Can I get alerts when storage crosses a threshold?
Yes -- alerts are managed in the Snoflo iOS app. Favorite this dam, set a threshold, and you'll get a push the moment conditions cross.
Dam data reference
Condition Assessment
- Satisfactory
- No existing or potential dam safety deficiencies are recognized. Acceptable performance is expected under all loading conditions (static, hydrologic, seismic) in accordance with the minimum applicable state or federal regulatory criteria or tolerable risk guidelines.
- Fair
- No existing dam safety deficiencies are recognized for normal operating conditions. Rare or extreme hydrologic and/or seismic events may result in a dam safety deficiency. Risk may be in the range to take further action.
- Poor
- A dam safety deficiency is recognized for normal operating conditions which may realistically occur. Remedial action is necessary. POOR may also be used when uncertainties exist as to critical analysis parameters which identify a potential dam safety deficiency.
- Unsatisfactory
- A dam safety deficiency is recognized that requires immediate or emergency remedial action for problem resolution.
- Not Rated
- The dam has not been inspected, is not under state or federal jurisdiction, or has been inspected but, for whatever reason, has not been rated.
Hazard Potential Classification
- High
- Dams assigned the high hazard potential classification are those where failure or mis-operation will probably cause loss of human life.
- Significant
- Dams assigned the significant hazard potential classification are those dams where failure or mis-operation results in no probable loss of human life but can cause economic loss, environmental damage, disruption of lifeline facilities, or impact other concerns. Significant hazard potential classification dams are often located in predominantly rural or agricultural areas but could be in areas with population and significant infrastructure.
- Low
- Dams assigned the low hazard potential classification are those where failure or mis-operation results in no probable loss of human life and low economic and/or environmental losses. Losses are principally limited to the owner's property.
- Undetermined
- Dams for which a downstream hazard potential has not been designated or is not provided.