Johnson Falls Dam

Johnson Falls
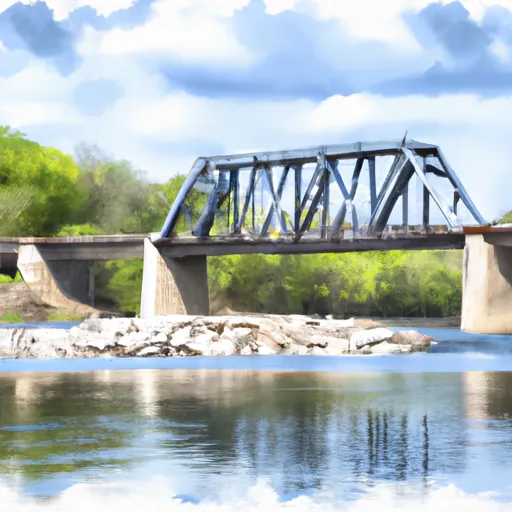
Johnson Falls is a captivating hydroelectric dam located on the Peshtigo River in Crivitz, Wisconsin. Built in 1923, this gravity dam stands at an impressive height of 43 feet and stretches 511 feet in length, with a storage capacity of 2500 acre-feet. The dam serves multiple purposes, including hydroelectric power generation and recreation, attracting water resource and climate enthusiasts alike.
Managed by the Federal Energy Regulatory Commission, Johnson Falls is a key player in the energy landscape of Wisconsin, with a maximum discharge capacity of 21,000 cubic feet per second. The dam's controlled spillway and Tainter radial gates ensure efficient water flow control, while its high hazard potential and very high risk assessment underscore the importance of robust risk management measures. While the dam's condition assessment is currently not available, its historical significance and impact on the surrounding environment make it a must-visit destination for those interested in water resource management and climate resilience.
Despite its age, Johnson Falls continues to stand as a testament to engineering ingenuity and sustainable resource management. With its picturesque location on the Peshtigo River and its crucial role in providing hydroelectric power to the region, this dam offers a unique opportunity for enthusiasts to explore the intersection of water resources, climate, and energy production. As visitors marvel at the dam's impressive structure and learn about its historical significance, they also gain a deeper appreciation for the complex and vital role that water resources play in our everyday lives.
Plan around the weather
Same NOAA / yr.no feed Snoflo's iOS app uses. Watch the precipitation column on the meteogram -- rain on the basin upstream typically lifts inflow 24-72 hours later.
Next 5 days, hour by hour
Temperature line with weather symbols on top, snow + rain accumulation as columns, humidity as a dotted line.
5-day forecast table
Every 3 hours, broken out across temperature, snow, rain, humidity, and wind. Each cell is colour-coded relative to the column min/max.
| Time | Condition | Temp (°F) | Snow (in) | Rain (in) | Humidity (%) | Wind (mps) | Wind dir |
|---|---|---|---|---|---|---|---|
| Loading detailed forecast… | |||||||
15-day temperature & precipitation
Daily temperatures, snow, and rain projected over the next two weeks.
Nearby streamflow gauges
USGS streamgauges around Johnson Falls -- inflows here typically show up in storage 24-72 hours later.
| Streamgauge | Discharge | View |
|---|---|---|
| Peshtigo River Near Wabeno | 189 cfs | → |
| Pike River At Amberg | 109 cfs | → |
| Peshtigo River At Porterfield | 334 cfs | → |
| Menominee River At White Rapids Dam Near Banat | 2,060 cfs | → |
| Menominee River At Koss | 2,240 cfs | → |
| Menominee River Near Mc Allister | 2,140 cfs | → |
Make a day of it
Boat launches, lakeside camping, fishing access, and other reservoirs near Johnson Falls .
Boat launches
See all →


Campgrounds
See all →


Fishing spots
See all →


River runs
See all →


About Johnson Falls
Where does the data for Johnson Falls come from?
Structural and regulatory data come from the U.S. Army Corps of Engineers' National Inventory of Dams (NID). Weather forecast comes from NOAA / yr.no -- the same feed Snoflo's iOS app uses.
How often is the report updated?
NID structural data refreshes annually as the Corps publishes updated assessments. The weather forecast refreshes throughout the day.
What does the High hazard rating mean?
The Corps of Engineers' hazard potential classification grades probable consequences if the dam fails: High = probable loss of human life; Significant = no probable loss of human life but possible economic loss / environmental damage; Low = no probable loss of human life, only minor economic / environmental losses. See the Dam Data Reference card below for the full definitions.
What's "% of normal"?
The current storage value compared to the historical average storage on this calendar day. 100% = right on average; values above 100% mean above-normal storage (wet year); values below mean below-normal (dry year or drought).
Can I get alerts when storage crosses a threshold?
Yes -- alerts are managed in the Snoflo iOS app. Favorite this dam, set a threshold, and you'll get a push the moment conditions cross.
Dam data reference
Condition Assessment
- Satisfactory
- No existing or potential dam safety deficiencies are recognized. Acceptable performance is expected under all loading conditions (static, hydrologic, seismic) in accordance with the minimum applicable state or federal regulatory criteria or tolerable risk guidelines.
- Fair
- No existing dam safety deficiencies are recognized for normal operating conditions. Rare or extreme hydrologic and/or seismic events may result in a dam safety deficiency. Risk may be in the range to take further action.
- Poor
- A dam safety deficiency is recognized for normal operating conditions which may realistically occur. Remedial action is necessary. POOR may also be used when uncertainties exist as to critical analysis parameters which identify a potential dam safety deficiency.
- Unsatisfactory
- A dam safety deficiency is recognized that requires immediate or emergency remedial action for problem resolution.
- Not Rated
- The dam has not been inspected, is not under state or federal jurisdiction, or has been inspected but, for whatever reason, has not been rated.
Hazard Potential Classification
- High
- Dams assigned the high hazard potential classification are those where failure or mis-operation will probably cause loss of human life.
- Significant
- Dams assigned the significant hazard potential classification are those dams where failure or mis-operation results in no probable loss of human life but can cause economic loss, environmental damage, disruption of lifeline facilities, or impact other concerns. Significant hazard potential classification dams are often located in predominantly rural or agricultural areas but could be in areas with population and significant infrastructure.
- Low
- Dams assigned the low hazard potential classification are those where failure or mis-operation results in no probable loss of human life and low economic and/or environmental losses. Losses are principally limited to the owner's property.
- Undetermined
- Dams for which a downstream hazard potential has not been designated or is not provided.