Scott Dam

Scott
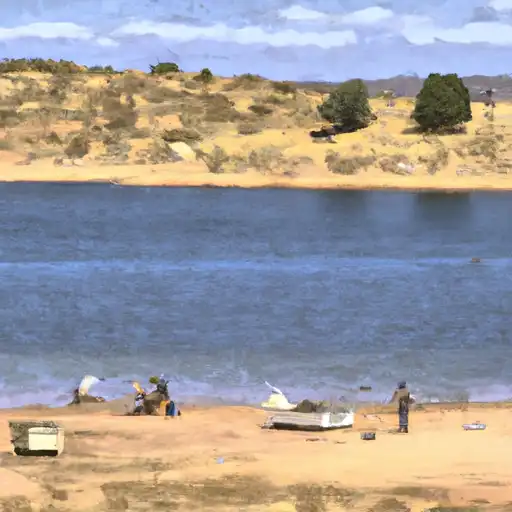
Scott is a privately owned dam located in Navajo, Arizona, on Porter Creek. Built in 1945 by the USDA NRCS, this earth dam stands at 38 feet high and spans 1050 feet in length, primarily serving irrigation purposes. Managed by the Arizona Department of Water Resources, Scott is regulated, permitted, inspected, and enforced by state authorities to ensure its safety and functionality. With a storage capacity of 1740 acre-feet and a surface area of 84 acres, this dam plays a crucial role in providing water supply to the surrounding area.
Despite its satisfactory condition assessment, Scott poses a significant hazard potential, with a moderate risk assessment rating. The spillway, equipped with an uncontrolled design and 450 feet wide, mitigates excess water flow. The dam's outlet gates are operated by slide (sluice gate) mechanisms, and it is inspected every three years to ensure its continued safety and functionality. While there have been no reported modifications in recent years, the dam's emergency action plan and risk management measures are not explicitly documented in the available data.
Situated in the Los Angeles District and under the jurisdiction of Tom O'Halleran (D), Scott represents a vital infrastructure for water resource management in the region. Its stone core and rock foundation contribute to its structural integrity, while its location in S13, T9S, R22E makes it a key element in the water supply and irrigation network of Jaques Dam & Show Low. Enthusiasts of water resources and climate will find Scott's historical significance, engineering features, and regulatory oversight fascinating aspects to explore further.
Plan around the weather
Same NOAA / yr.no feed Snoflo's iOS app uses. Watch the precipitation column on the meteogram -- rain on the basin upstream typically lifts inflow 24-72 hours later.
Next 5 days, hour by hour
Temperature line with weather symbols on top, snow + rain accumulation as columns, humidity as a dotted line.
5-day forecast table
Every 3 hours, broken out across temperature, snow, rain, humidity, and wind. Each cell is colour-coded relative to the column min/max.
| Time | Condition | Temp (°F) | Snow (in) | Rain (in) | Humidity (%) | Wind (mps) | Wind dir |
|---|---|---|---|---|---|---|---|
| Loading detailed forecast… | |||||||
15-day temperature & precipitation
Daily temperatures, snow, and rain projected over the next two weeks.
Nearby streamflow gauges
USGS streamgauges around Scott -- inflows here typically show up in storage 24-72 hours later.
| Streamgauge | Discharge | View |
|---|---|---|
| Show Low Creek Near Lakeside | 0 cfs | → |
| Carrizo Creek Near Show Low | 4 cfs | → |
| East Fork White River Near Fort Apache | 20 cfs | → |
| Little Colorado River At Greer | 6 cfs | → |
| Filler Ditch At Greer | 1 cfs | → |
| White River Near Fort Apache | 20 cfs | → |
Make a day of it
Boat launches, lakeside camping, fishing access, and other reservoirs near Scott.
Boat launches
See all →


Campgrounds
See all →


Fishing spots
See all →


River runs
See all →


About Scott
Where does the data for Scott come from?
Structural and regulatory data come from the U.S. Army Corps of Engineers' National Inventory of Dams (NID). Weather forecast comes from NOAA / yr.no -- the same feed Snoflo's iOS app uses.
How often is the report updated?
NID structural data refreshes annually as the Corps publishes updated assessments. The weather forecast refreshes throughout the day.
What does the Significant hazard rating mean?
The Corps of Engineers' hazard potential classification grades probable consequences if the dam fails: High = probable loss of human life; Significant = no probable loss of human life but possible economic loss / environmental damage; Low = no probable loss of human life, only minor economic / environmental losses. See the Dam Data Reference card below for the full definitions.
What's "% of normal"?
The current storage value compared to the historical average storage on this calendar day. 100% = right on average; values above 100% mean above-normal storage (wet year); values below mean below-normal (dry year or drought).
Can I get alerts when storage crosses a threshold?
Yes -- alerts are managed in the Snoflo iOS app. Favorite this dam, set a threshold, and you'll get a push the moment conditions cross.
Dam data reference
Condition Assessment
- Satisfactory
- No existing or potential dam safety deficiencies are recognized. Acceptable performance is expected under all loading conditions (static, hydrologic, seismic) in accordance with the minimum applicable state or federal regulatory criteria or tolerable risk guidelines.
- Fair
- No existing dam safety deficiencies are recognized for normal operating conditions. Rare or extreme hydrologic and/or seismic events may result in a dam safety deficiency. Risk may be in the range to take further action.
- Poor
- A dam safety deficiency is recognized for normal operating conditions which may realistically occur. Remedial action is necessary. POOR may also be used when uncertainties exist as to critical analysis parameters which identify a potential dam safety deficiency.
- Unsatisfactory
- A dam safety deficiency is recognized that requires immediate or emergency remedial action for problem resolution.
- Not Rated
- The dam has not been inspected, is not under state or federal jurisdiction, or has been inspected but, for whatever reason, has not been rated.
Hazard Potential Classification
- High
- Dams assigned the high hazard potential classification are those where failure or mis-operation will probably cause loss of human life.
- Significant
- Dams assigned the significant hazard potential classification are those dams where failure or mis-operation results in no probable loss of human life but can cause economic loss, environmental damage, disruption of lifeline facilities, or impact other concerns. Significant hazard potential classification dams are often located in predominantly rural or agricultural areas but could be in areas with population and significant infrastructure.
- Low
- Dams assigned the low hazard potential classification are those where failure or mis-operation results in no probable loss of human life and low economic and/or environmental losses. Losses are principally limited to the owner's property.
- Undetermined
- Dams for which a downstream hazard potential has not been designated or is not provided.