Taylor Wwtp (basins 1 & 2) Dam

Taylor Wwtp (Basins 1 & 2)
Taylor Wastewater Treatment Plant (WWTP), located in Navajo, Arizona, is a vital facility owned by the local government and regulated by the Arizona Department of Water Resources. The plant serves as a crucial hub for water treatment in the region, with two basins (Basins 1 & 2) that play a key role in managing water resources and ensuring environmental sustainability. The plant's primary purpose is listed as "Other," indicating its versatility in addressing various water treatment needs.
With a low hazard potential and a high risk assessment rating, Taylor WWTP is well-equipped to handle potential emergencies and ensure the safety of the surrounding community. The plant boasts a notable storage capacity of 61.1 acre-feet and covers a surface area of 9.31 acres. Despite being classified as an Earth dam with a height of 10 feet, the plant's spillway type is listed as "None," highlighting its efficient design and operation. Additionally, the plant undergoes regular inspections every five years to maintain its structural integrity and operational efficiency.
In conclusion, Taylor WWTP stands as a critical asset in the water management infrastructure of Navajo, Arizona, with a focus on sustainable water treatment and resource conservation. The plant's adherence to state regulations, frequent inspections, and low hazard potential demonstrate its commitment to environmental stewardship and public safety. As water resource and climate enthusiasts, it is essential to recognize and support facilities like Taylor WWTP that play a vital role in ensuring the sustainability and resilience of water systems in local communities.
Plan around the weather
Same NOAA / yr.no feed Snoflo's iOS app uses. Watch the precipitation column on the meteogram -- rain on the basin upstream typically lifts inflow 24-72 hours later.
Next 5 days, hour by hour
Temperature line with weather symbols on top, snow + rain accumulation as columns, humidity as a dotted line.
5-day forecast table
Every 3 hours, broken out across temperature, snow, rain, humidity, and wind. Each cell is colour-coded relative to the column min/max.
| Time | Condition | Temp (°F) | Snow (in) | Rain (in) | Humidity (%) | Wind (mps) | Wind dir |
|---|---|---|---|---|---|---|---|
| Loading detailed forecast… | |||||||
15-day temperature & precipitation
Daily temperatures, snow, and rain projected over the next two weeks.
Nearby streamflow gauges
USGS streamgauges around Taylor Wwtp (Basins 1 & 2) -- inflows here typically show up in storage 24-72 hours later.
| Streamgauge | Discharge | View |
|---|---|---|
| Show Low Creek Near Lakeside | 0 cfs | → |
| Little Colorado River At Woodruff | 14 cfs | → |
| Little Colorado River At Holbrook | 139 cfs | → |
| Little Colorado River Near Joseph City | 541 cfs | → |
| Little Colorado R Blw Zion Res Nr St. Johns | 42 cfs | → |
| Carrizo Creek Near Show Low | 2 cfs | → |
Make a day of it
Boat launches, lakeside camping, fishing access, and other reservoirs near Taylor Wwtp (Basins 1 & 2).
Boat launches
See all →


Campgrounds
See all →


Fishing spots
See all →


River runs
See all →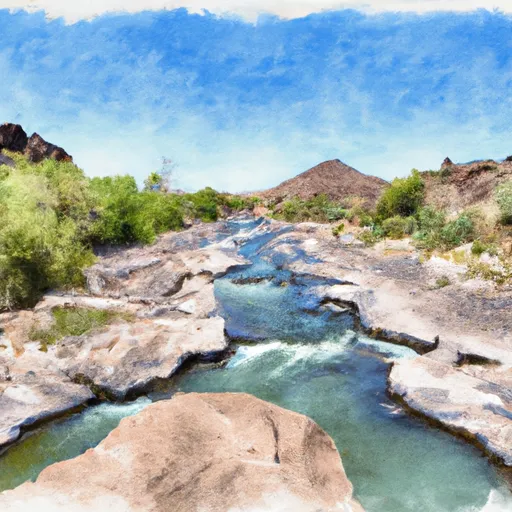


About Taylor Wwtp (Basins 1 & 2)
Where does the data for Taylor Wwtp (basins 1 & 2) come from?
Structural and regulatory data come from the U.S. Army Corps of Engineers' National Inventory of Dams (NID). Weather forecast comes from NOAA / yr.no -- the same feed Snoflo's iOS app uses.
How often is the report updated?
NID structural data refreshes annually as the Corps publishes updated assessments. The weather forecast refreshes throughout the day.
What does the Low hazard rating mean?
The Corps of Engineers' hazard potential classification grades probable consequences if the dam fails: High = probable loss of human life; Significant = no probable loss of human life but possible economic loss / environmental damage; Low = no probable loss of human life, only minor economic / environmental losses. See the Dam Data Reference card below for the full definitions.
What's "% of normal"?
The current storage value compared to the historical average storage on this calendar day. 100% = right on average; values above 100% mean above-normal storage (wet year); values below mean below-normal (dry year or drought).
Can I get alerts when storage crosses a threshold?
Yes -- alerts are managed in the Snoflo iOS app. Favorite this dam, set a threshold, and you'll get a push the moment conditions cross.
Dam data reference
Condition Assessment
- Satisfactory
- No existing or potential dam safety deficiencies are recognized. Acceptable performance is expected under all loading conditions (static, hydrologic, seismic) in accordance with the minimum applicable state or federal regulatory criteria or tolerable risk guidelines.
- Fair
- No existing dam safety deficiencies are recognized for normal operating conditions. Rare or extreme hydrologic and/or seismic events may result in a dam safety deficiency. Risk may be in the range to take further action.
- Poor
- A dam safety deficiency is recognized for normal operating conditions which may realistically occur. Remedial action is necessary. POOR may also be used when uncertainties exist as to critical analysis parameters which identify a potential dam safety deficiency.
- Unsatisfactory
- A dam safety deficiency is recognized that requires immediate or emergency remedial action for problem resolution.
- Not Rated
- The dam has not been inspected, is not under state or federal jurisdiction, or has been inspected but, for whatever reason, has not been rated.
Hazard Potential Classification
- High
- Dams assigned the high hazard potential classification are those where failure or mis-operation will probably cause loss of human life.
- Significant
- Dams assigned the significant hazard potential classification are those dams where failure or mis-operation results in no probable loss of human life but can cause economic loss, environmental damage, disruption of lifeline facilities, or impact other concerns. Significant hazard potential classification dams are often located in predominantly rural or agricultural areas but could be in areas with population and significant infrastructure.
- Low
- Dams assigned the low hazard potential classification are those where failure or mis-operation results in no probable loss of human life and low economic and/or environmental losses. Losses are principally limited to the owner's property.
- Undetermined
- Dams for which a downstream hazard potential has not been designated or is not provided.