Reservoir Dike Dam

Reservoir Dike
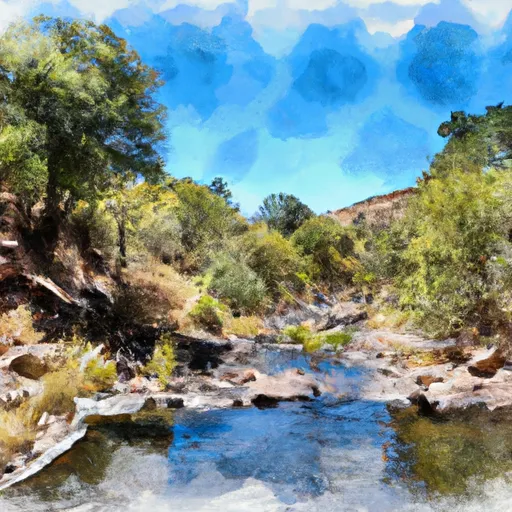
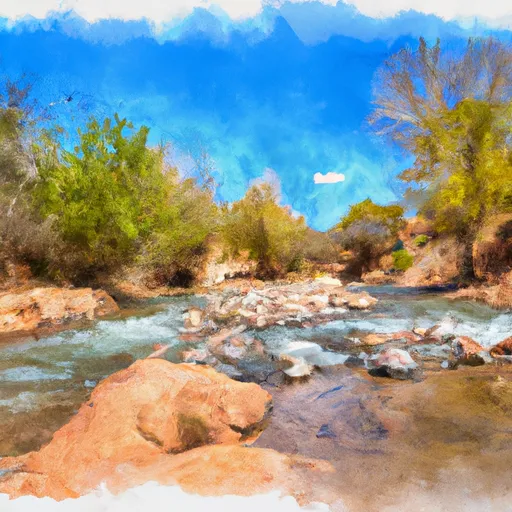
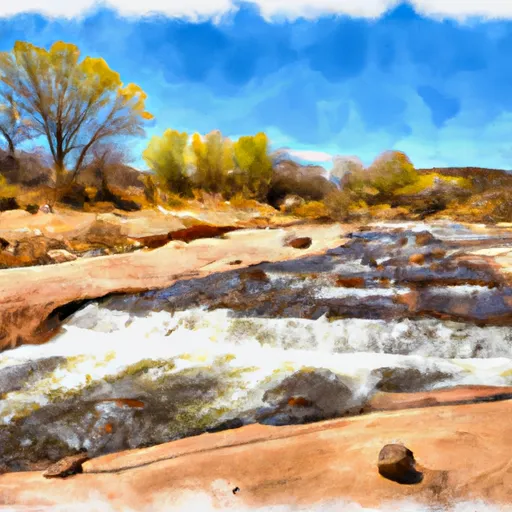
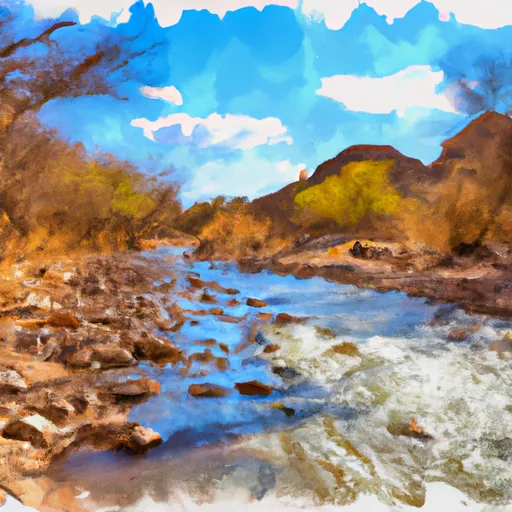
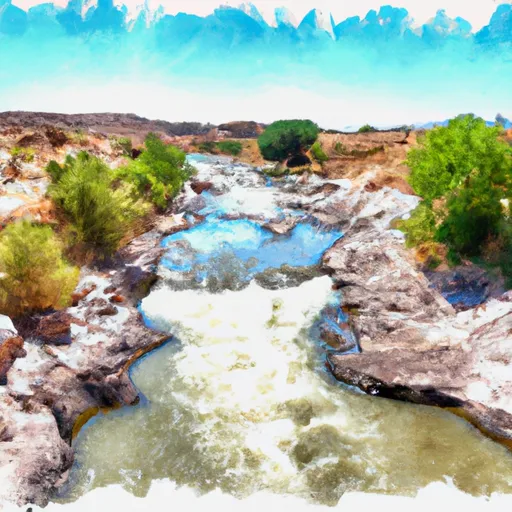
Reservoir Dike, located in Graham, Arizona, is a gravity dam primarily constructed for flood risk reduction purposes. Managed by the Bureau of Land Management, this federal-owned structure was completed in 1975 and has a hydraulic height of 16 feet and a structural height of 20 feet. With a storage capacity of 124.71 acre-feet, Reservoir Dike serves to mitigate potential flooding in the area, safeguarding nearby communities and ecosystems.
Despite its low hazard potential, Reservoir Dike has not been rated for its condition assessment. The dam spans a length of 1050 feet, with a surface area of 11.94 acres and a normal storage capacity of 48.62 acre-feet. While it is not regulated at the state level, the dam's inspection frequency is set at 5 years. With no associated structures and no outlet gates, Reservoir Dike stands as a crucial infrastructure for flood control in the region, highlighting the importance of water resource management and climate resilience efforts.
As water resource and climate enthusiasts, understanding the significance of dams like Reservoir Dike is essential in recognizing their role in mitigating the impacts of extreme weather events. By maintaining and monitoring these structures, we can ensure the safety and sustainability of water resources, protecting communities and ecosystems from the threats posed by floods and other hydrological risks. With its historical construction and ongoing management by the Bureau of Land Management, Reservoir Dike stands as a testament to the vital role of infrastructure in climate adaptation and water security.
Plan around the weather
Same NOAA / yr.no feed Snoflo's iOS app uses. Watch the precipitation column on the meteogram -- rain on the basin upstream typically lifts inflow 24-72 hours later.
Next 5 days, hour by hour
Temperature line with weather symbols on top, snow + rain accumulation as columns, humidity as a dotted line.
5-day forecast table
Every 3 hours, broken out across temperature, snow, rain, humidity, and wind. Each cell is colour-coded relative to the column min/max.
| Time | Condition | Temp (°F) | Snow (in) | Rain (in) | Humidity (%) | Wind (mps) | Wind dir |
|---|---|---|---|---|---|---|---|
| Loading detailed forecast… | |||||||
15-day temperature & precipitation
Daily temperatures, snow, and rain projected over the next two weeks.
Nearby streamflow gauges
USGS streamgauges around Reservoir Dike -- inflows here typically show up in storage 24-72 hours later.
| Streamgauge | Discharge | View |
|---|---|---|
| Gila River At Head Of Safford Valley | 222 cfs | → |
| Frye Creek Near Thatcher | 1 cfs | → |
| Bonita Creek Near Morenci | 2 cfs | → |
| Gila River Near Clifton | 16 cfs | → |
| Eagle Creek Above Pumping Plant | 38 cfs | → |
| Gila River At Duncan | 93 cfs | → |


About Reservoir Dike
Where does the data for Reservoir Dike come from?
Structural and regulatory data come from the U.S. Army Corps of Engineers' National Inventory of Dams (NID). Weather forecast comes from NOAA / yr.no -- the same feed Snoflo's iOS app uses.
How often is the report updated?
NID structural data refreshes annually as the Corps publishes updated assessments. The weather forecast refreshes throughout the day.
What does the Low hazard rating mean?
The Corps of Engineers' hazard potential classification grades probable consequences if the dam fails: High = probable loss of human life; Significant = no probable loss of human life but possible economic loss / environmental damage; Low = no probable loss of human life, only minor economic / environmental losses. See the Dam Data Reference card below for the full definitions.
What's "% of normal"?
The current storage value compared to the historical average storage on this calendar day. 100% = right on average; values above 100% mean above-normal storage (wet year); values below mean below-normal (dry year or drought).
Can I get alerts when storage crosses a threshold?
Yes -- alerts are managed in the Snoflo iOS app. Favorite this dam, set a threshold, and you'll get a push the moment conditions cross.
Dam data reference
Condition Assessment
- Satisfactory
- No existing or potential dam safety deficiencies are recognized. Acceptable performance is expected under all loading conditions (static, hydrologic, seismic) in accordance with the minimum applicable state or federal regulatory criteria or tolerable risk guidelines.
- Fair
- No existing dam safety deficiencies are recognized for normal operating conditions. Rare or extreme hydrologic and/or seismic events may result in a dam safety deficiency. Risk may be in the range to take further action.
- Poor
- A dam safety deficiency is recognized for normal operating conditions which may realistically occur. Remedial action is necessary. POOR may also be used when uncertainties exist as to critical analysis parameters which identify a potential dam safety deficiency.
- Unsatisfactory
- A dam safety deficiency is recognized that requires immediate or emergency remedial action for problem resolution.
- Not Rated
- The dam has not been inspected, is not under state or federal jurisdiction, or has been inspected but, for whatever reason, has not been rated.
Hazard Potential Classification
- High
- Dams assigned the high hazard potential classification are those where failure or mis-operation will probably cause loss of human life.
- Significant
- Dams assigned the significant hazard potential classification are those dams where failure or mis-operation results in no probable loss of human life but can cause economic loss, environmental damage, disruption of lifeline facilities, or impact other concerns. Significant hazard potential classification dams are often located in predominantly rural or agricultural areas but could be in areas with population and significant infrastructure.
- Low
- Dams assigned the low hazard potential classification are those where failure or mis-operation results in no probable loss of human life and low economic and/or environmental losses. Losses are principally limited to the owner's property.
- Undetermined
- Dams for which a downstream hazard potential has not been designated or is not provided.