Page Effluent Ponds 2a & 2b dam

Page Effluent Ponds 2a & 2b
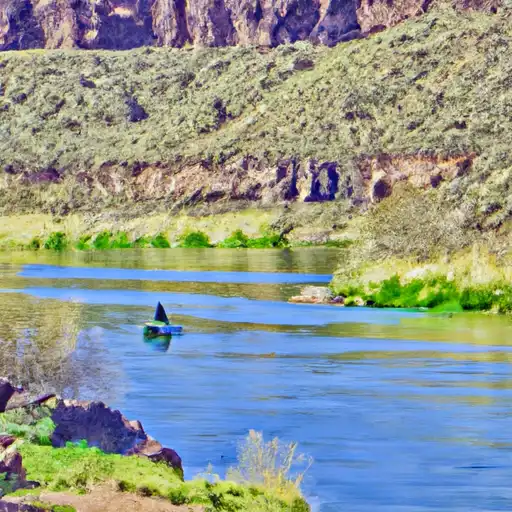
Page Effluent Ponds 2a & 2b, located in Coconino, Arizona, are essential for the local government's water management. These ponds are regulated by the Arizona Department of Water Resources and have a low hazard potential. With a primary purpose listed as 'Other', these Earth-type dams were completed in 1998 and have a normal storage capacity of 204.2 acre-feet. The ponds cover a surface area of 13.1 acres and are connected to the Colorado River via Honey Draw - TR.
Despite being last inspected in 2012 and rated as 'Not Rated' in condition assessment, the risk associated with Page Effluent Ponds 2a & 2b is moderate. The spillway type is listed as 'Uncontrolled', indicating a potential for unregulated discharge in case of overflow. The emergency action plan status and risk management measures for these ponds remain unspecified, highlighting the need for updated safety protocols and preparedness in case of an unforeseen event.
Water resource and climate enthusiasts would find Page Effluent Ponds 2a & 2b an intriguing case study in water infrastructure management. The location, design, and purpose of these ponds offer insights into the complex network of water management systems in place, while the risk assessment and hazard potential provide valuable data for understanding and improving overall water resource sustainability and resilience in the face of changing climatic conditions.
Plan around the weather
Same NOAA / yr.no feed Snoflo's iOS app uses. Watch the precipitation column on the meteogram -- rain on the basin upstream typically lifts inflow 24-72 hours later.
Next 5 days, hour by hour
Temperature line with weather symbols on top, snow + rain accumulation as columns, humidity as a dotted line.
5-day forecast table
Every 3 hours, broken out across temperature, snow, rain, humidity, and wind. Each cell is colour-coded relative to the column min/max.
| Time | Condition | Temp (°F) | Snow (in) | Rain (in) | Humidity (%) | Wind (mps) | Wind dir |
|---|---|---|---|---|---|---|---|
| Loading detailed forecast… | |||||||
15-day temperature & precipitation
Daily temperatures, snow, and rain projected over the next two weeks.
Nearby streamflow gauges
USGS streamgauges around Page Effluent Ponds 2a & 2b -- inflows here typically show up in storage 24-72 hours later.
| Streamgauge | Discharge | View |
|---|---|---|
| Colorado River At Lees Ferry | 9,060 cfs | → |
| Paria River At Lees Ferry | 3 cfs | → |
| Paria River Near Kanab | 0 cfs | → |
| Little Colorado River Abv Mouth Nr Desert View | 215 cfs | → |


About Page Effluent Ponds 2a & 2b
Where does the data for Page Effluent Ponds 2a & 2b come from?
Structural and regulatory data come from the U.S. Army Corps of Engineers' National Inventory of Dams (NID). Weather forecast comes from NOAA / yr.no -- the same feed Snoflo's iOS app uses.
How often is the report updated?
NID structural data refreshes annually as the Corps publishes updated assessments. The weather forecast refreshes throughout the day.
What does the Low hazard rating mean?
The Corps of Engineers' hazard potential classification grades probable consequences if the dam fails: High = probable loss of human life; Significant = no probable loss of human life but possible economic loss / environmental damage; Low = no probable loss of human life, only minor economic / environmental losses. See the Dam Data Reference card below for the full definitions.
What's "% of normal"?
The current storage value compared to the historical average storage on this calendar day. 100% = right on average; values above 100% mean above-normal storage (wet year); values below mean below-normal (dry year or drought).
Can I get alerts when storage crosses a threshold?
Yes -- alerts are managed in the Snoflo iOS app. Favorite this dam, set a threshold, and you'll get a push the moment conditions cross.
Dam data reference
Condition Assessment
- Satisfactory
- No existing or potential dam safety deficiencies are recognized. Acceptable performance is expected under all loading conditions (static, hydrologic, seismic) in accordance with the minimum applicable state or federal regulatory criteria or tolerable risk guidelines.
- Fair
- No existing dam safety deficiencies are recognized for normal operating conditions. Rare or extreme hydrologic and/or seismic events may result in a dam safety deficiency. Risk may be in the range to take further action.
- Poor
- A dam safety deficiency is recognized for normal operating conditions which may realistically occur. Remedial action is necessary. POOR may also be used when uncertainties exist as to critical analysis parameters which identify a potential dam safety deficiency.
- Unsatisfactory
- A dam safety deficiency is recognized that requires immediate or emergency remedial action for problem resolution.
- Not Rated
- The dam has not been inspected, is not under state or federal jurisdiction, or has been inspected but, for whatever reason, has not been rated.
Hazard Potential Classification
- High
- Dams assigned the high hazard potential classification are those where failure or mis-operation will probably cause loss of human life.
- Significant
- Dams assigned the significant hazard potential classification are those dams where failure or mis-operation results in no probable loss of human life but can cause economic loss, environmental damage, disruption of lifeline facilities, or impact other concerns. Significant hazard potential classification dams are often located in predominantly rural or agricultural areas but could be in areas with population and significant infrastructure.
- Low
- Dams assigned the low hazard potential classification are those where failure or mis-operation results in no probable loss of human life and low economic and/or environmental losses. Losses are principally limited to the owner's property.
- Undetermined
- Dams for which a downstream hazard potential has not been designated or is not provided.