Fish Barrier dam

Fish Barrier
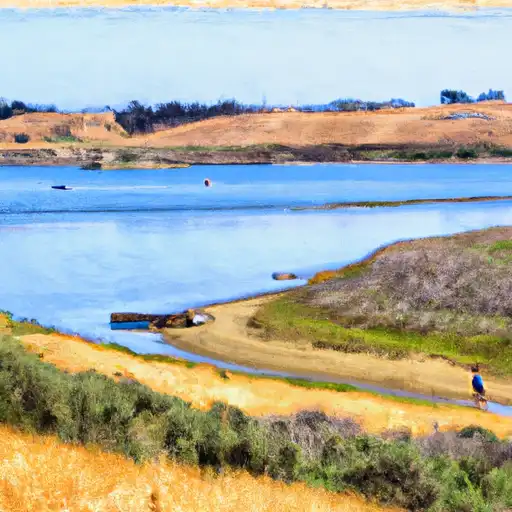
The Fish Barrier in Marysville, California, is a crucial structure designed to regulate the flow of the Feather River and ensure water supply for irrigation purposes. Completed in 1964, this concrete gravity dam stands at a height of 61 feet and has a structural height of 91 feet. With a storage capacity of 580 acre-feet and a maximum discharge of 80,000 cubic feet per second, the Fish Barrier plays a vital role in managing water resources in Butte County.
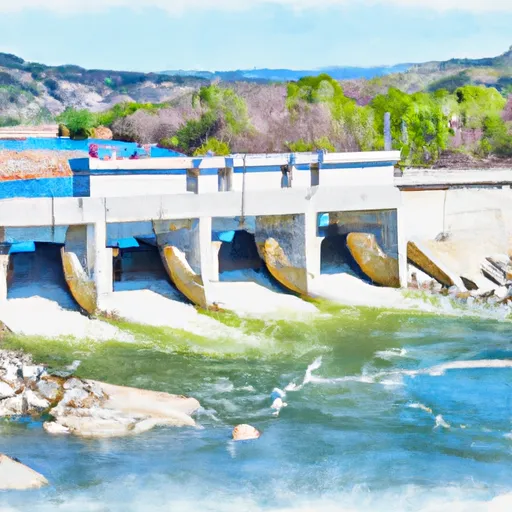
Managed by the State of California and regulated by the Department of Water Resources and the Safety of Dams, the Fish Barrier undergoes regular inspections to ensure its safe operation. The dam's low hazard potential and moderate risk assessment indicate that it is well-maintained and poses minimal risk to surrounding areas. As a state-regulated structure, the Fish Barrier is equipped with an uncontrolled spillway that is 600 feet wide, allowing excess water to flow safely downstream without causing harm to the environment or nearby communities.
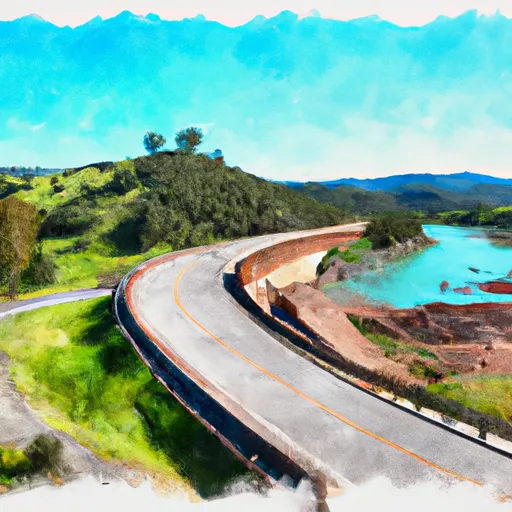
Located in a strategic position within the Feather River watershed, the Fish Barrier serves as a key component of California's water infrastructure. With its primary purpose being water supply, this dam not only supports irrigation activities but also contributes to the overall sustainability of the region's water resources. As water resource and climate enthusiasts, it is essential to recognize the importance of structures like the Fish Barrier in ensuring the efficient management and conservation of water for future generations.
Plan around the weather
Same NOAA / yr.no feed Snoflo's iOS app uses. Watch the precipitation column on the meteogram -- rain on the basin upstream typically lifts inflow 24-72 hours later.
Next 5 days, hour by hour
Temperature line with weather symbols on top, snow + rain accumulation as columns, humidity as a dotted line.
5-day forecast table
Every 3 hours, broken out across temperature, snow, rain, humidity, and wind. Each cell is colour-coded relative to the column min/max.
| Time | Condition | Temp (°F) | Snow (in) | Rain (in) | Humidity (%) | Wind (mps) | Wind dir |
|---|---|---|---|---|---|---|---|
| Loading detailed forecast… | |||||||
15-day temperature & precipitation
Daily temperatures, snow, and rain projected over the next two weeks.
Nearby streamflow gauges
USGS streamgauges around Fish Barrier -- inflows here typically show up in storage 24-72 hours later.
| Streamgauge | Discharge | View |
|---|---|---|
| Butte C Nr Chico Ca | 164 cfs | → |
| Yuba R Nr Marysville Ca | 522 cfs | → |
| Deer C Nr Smartville Ca | 3 cfs | → |
| Sacramento R A Colusa Ca | 8,660 cfs | → |
| N Yuba R Bl Goodyears Bar Ca | 175 cfs | → |
| Bear R Nr Wheatland Ca | 28 cfs | → |


About Fish Barrier
Where does the data for Fish Barrier come from?
Structural and regulatory data come from the U.S. Army Corps of Engineers' National Inventory of Dams (NID). Weather forecast comes from NOAA / yr.no -- the same feed Snoflo's iOS app uses.
How often is the report updated?
NID structural data refreshes annually as the Corps publishes updated assessments. The weather forecast refreshes throughout the day.
What does the Low hazard rating mean?
The Corps of Engineers' hazard potential classification grades probable consequences if the dam fails: High = probable loss of human life; Significant = no probable loss of human life but possible economic loss / environmental damage; Low = no probable loss of human life, only minor economic / environmental losses. See the Dam Data Reference card below for the full definitions.
What's "% of normal"?
The current storage value compared to the historical average storage on this calendar day. 100% = right on average; values above 100% mean above-normal storage (wet year); values below mean below-normal (dry year or drought).
Can I get alerts when storage crosses a threshold?
Yes -- alerts are managed in the Snoflo iOS app. Favorite this dam, set a threshold, and you'll get a push the moment conditions cross.
Dam data reference
Condition Assessment
- Satisfactory
- No existing or potential dam safety deficiencies are recognized. Acceptable performance is expected under all loading conditions (static, hydrologic, seismic) in accordance with the minimum applicable state or federal regulatory criteria or tolerable risk guidelines.
- Fair
- No existing dam safety deficiencies are recognized for normal operating conditions. Rare or extreme hydrologic and/or seismic events may result in a dam safety deficiency. Risk may be in the range to take further action.
- Poor
- A dam safety deficiency is recognized for normal operating conditions which may realistically occur. Remedial action is necessary. POOR may also be used when uncertainties exist as to critical analysis parameters which identify a potential dam safety deficiency.
- Unsatisfactory
- A dam safety deficiency is recognized that requires immediate or emergency remedial action for problem resolution.
- Not Rated
- The dam has not been inspected, is not under state or federal jurisdiction, or has been inspected but, for whatever reason, has not been rated.
Hazard Potential Classification
- High
- Dams assigned the high hazard potential classification are those where failure or mis-operation will probably cause loss of human life.
- Significant
- Dams assigned the significant hazard potential classification are those dams where failure or mis-operation results in no probable loss of human life but can cause economic loss, environmental damage, disruption of lifeline facilities, or impact other concerns. Significant hazard potential classification dams are often located in predominantly rural or agricultural areas but could be in areas with population and significant infrastructure.
- Low
- Dams assigned the low hazard potential classification are those where failure or mis-operation results in no probable loss of human life and low economic and/or environmental losses. Losses are principally limited to the owner's property.
- Undetermined
- Dams for which a downstream hazard potential has not been designated or is not provided.