Buford Dam Dam

Buford Dam
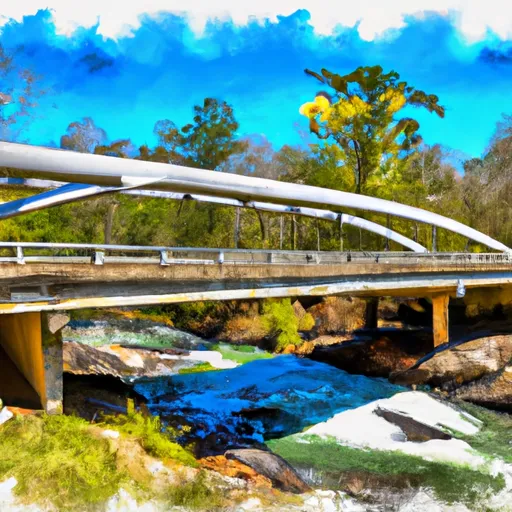
Buford Dam, also known as Lake Sidney Lanier, is a crucial federal structure located on the Chattahoochee River in Georgia's Gwinnett County. Completed in 1958 by the US Army Corps of Engineers, this earth dam serves primarily for flood risk reduction but also supports hydroelectric power generation and recreational activities. With a height of 231 feet and a storage capacity of 2.55 million acre-feet, Buford Dam plays a vital role in water resource management and protection in the Atlanta metropolitan area.
Despite being classified as having a high hazard potential, Buford Dam is well-designed, well-constructed, and well-maintained. The risk assessment conducted by the US Army Corps of Engineers in 2020 identified moderate risks associated with the dam, highlighting potential scenarios of catastrophic flooding downstream in case of a dam failure. To manage these risks, the Corps continuously collaborates with local emergency managers, updates emergency action plans, conducts regular inspections, and engages in maintenance and repair activities when needed.
As a water resource and climate enthusiast, staying informed about the risk management measures for Buford Dam is crucial. Engaging with local representatives, purchasing flood insurance, creating a family emergency plan, and being aware of evacuation routes are essential steps to ensure preparedness and safety in the event of a major flood. By following updates from the Mobile District and Lake Lanier on social media and taking proactive measures, individuals can contribute to the resilience of the community and the protection of water resources in the region.
Plan around the weather
Same NOAA / yr.no feed Snoflo's iOS app uses. Watch the precipitation column on the meteogram -- rain on the basin upstream typically lifts inflow 24-72 hours later.
Next 5 days, hour by hour
Temperature line with weather symbols on top, snow + rain accumulation as columns, humidity as a dotted line.
5-day forecast table
Every 3 hours, broken out across temperature, snow, rain, humidity, and wind. Each cell is colour-coded relative to the column min/max.
| Time | Condition | Temp (°F) | Snow (in) | Rain (in) | Humidity (%) | Wind (mps) | Wind dir |
|---|---|---|---|---|---|---|---|
| Loading detailed forecast… | |||||||
15-day temperature & precipitation
Daily temperatures, snow, and rain projected over the next two weeks.
Nearby streamflow gauges
USGS streamgauges around Buford Dam -- inflows here typically show up in storage 24-72 hours later.
| Streamgauge | Discharge | View |
|---|---|---|
| Chattahoochee River At Buford Dam | 629 cfs | → |
| Richland Creek At Suwanee Dam Road | 52 cfs | → |
| Level Creek At Suwanee Dam Road | 20 cfs | → |
| Dick Creek At Old Atlanta Rd | 6 cfs | → |
| Suwanee Creek At Suwanee | 502 cfs | → |
| Chattahoochee River Near Norcross | 2,740 cfs | → |


About Buford Dam
Where does the data for Buford Dam come from?
Structural and regulatory data come from the U.S. Army Corps of Engineers' National Inventory of Dams (NID). Weather forecast comes from NOAA / yr.no -- the same feed Snoflo's iOS app uses.
How often is the report updated?
NID structural data refreshes annually as the Corps publishes updated assessments. The weather forecast refreshes throughout the day.
What does the High hazard rating mean?
The Corps of Engineers' hazard potential classification grades probable consequences if the dam fails: High = probable loss of human life; Significant = no probable loss of human life but possible economic loss / environmental damage; Low = no probable loss of human life, only minor economic / environmental losses. See the Dam Data Reference card below for the full definitions.
What's "% of normal"?
The current storage value compared to the historical average storage on this calendar day. 100% = right on average; values above 100% mean above-normal storage (wet year); values below mean below-normal (dry year or drought).
Can I get alerts when storage crosses a threshold?
Yes -- alerts are managed in the Snoflo iOS app. Favorite this dam, set a threshold, and you'll get a push the moment conditions cross.
Dam data reference
Condition Assessment
- Satisfactory
- No existing or potential dam safety deficiencies are recognized. Acceptable performance is expected under all loading conditions (static, hydrologic, seismic) in accordance with the minimum applicable state or federal regulatory criteria or tolerable risk guidelines.
- Fair
- No existing dam safety deficiencies are recognized for normal operating conditions. Rare or extreme hydrologic and/or seismic events may result in a dam safety deficiency. Risk may be in the range to take further action.
- Poor
- A dam safety deficiency is recognized for normal operating conditions which may realistically occur. Remedial action is necessary. POOR may also be used when uncertainties exist as to critical analysis parameters which identify a potential dam safety deficiency.
- Unsatisfactory
- A dam safety deficiency is recognized that requires immediate or emergency remedial action for problem resolution.
- Not Rated
- The dam has not been inspected, is not under state or federal jurisdiction, or has been inspected but, for whatever reason, has not been rated.
Hazard Potential Classification
- High
- Dams assigned the high hazard potential classification are those where failure or mis-operation will probably cause loss of human life.
- Significant
- Dams assigned the significant hazard potential classification are those dams where failure or mis-operation results in no probable loss of human life but can cause economic loss, environmental damage, disruption of lifeline facilities, or impact other concerns. Significant hazard potential classification dams are often located in predominantly rural or agricultural areas but could be in areas with population and significant infrastructure.
- Low
- Dams assigned the low hazard potential classification are those where failure or mis-operation results in no probable loss of human life and low economic and/or environmental losses. Losses are principally limited to the owner's property.
- Undetermined
- Dams for which a downstream hazard potential has not been designated or is not provided.