Lake Toccoa Dam Dam

Lake Toccoa Dam
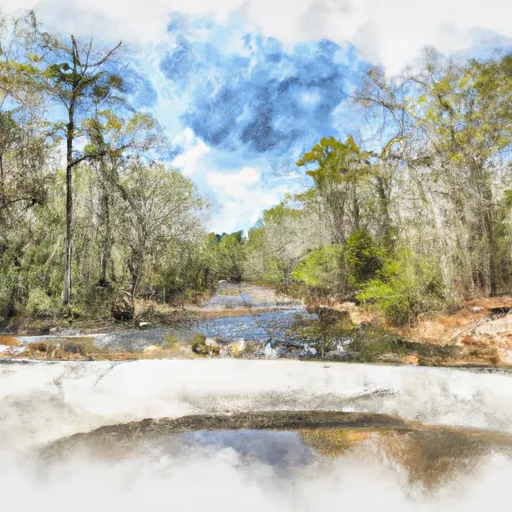
Lake Toccoa Dam, also known as Toccoa Boy Scout Camp Dam, is a private-owned structure located in Rabun, Georgia. Built in 1953, this earth dam stands at a height of 28 feet and spans a length of 350 feet, creating a reservoir with a storage capacity of 104 acre-feet. The dam's primary purpose is for recreation, offering opportunities for outdoor activities in a picturesque setting.
Managed by the Georgia-SAFE DAMS PROGRAM, Lake Toccoa Dam is regulated, inspected, and enforced by the state to ensure its safety and structural integrity. The dam poses a high hazard potential but has been assessed as satisfactory in condition. Despite its moderate risk rating, the dam has not had an Emergency Action Plan (EAP) prepared as of the latest data update in April 2021.
Situated on SHE CREEK, this dam is a vital part of the local water resource infrastructure, providing not only recreational benefits but also contributing to the overall water management of the area. Enthusiasts of water resources and climate will find Lake Toccoa Dam an interesting subject of study, given its design features, state oversight, and risk management considerations.
Plan around the weather
Same NOAA / yr.no feed Snoflo's iOS app uses. Watch the precipitation column on the meteogram -- rain on the basin upstream typically lifts inflow 24-72 hours later.
Next 5 days, hour by hour
Temperature line with weather symbols on top, snow + rain accumulation as columns, humidity as a dotted line.
5-day forecast table
Every 3 hours, broken out across temperature, snow, rain, humidity, and wind. Each cell is colour-coded relative to the column min/max.
| Time | Condition | Temp (°F) | Snow (in) | Rain (in) | Humidity (%) | Wind (mps) | Wind dir |
|---|---|---|---|---|---|---|---|
| Loading detailed forecast… | |||||||
15-day temperature & precipitation
Daily temperatures, snow, and rain projected over the next two weeks.
Nearby streamflow gauges
USGS streamgauges around Lake Toccoa Dam -- inflows here typically show up in storage 24-72 hours later.
| Streamgauge | Discharge | View |
|---|---|---|
| Chattooga River Near Clayton | 243 cfs | → |
| Tallulah River Ab Powerhouse | 37 cfs | → |
| Tallulah River Near Clayton | 107 cfs | → |
| Little Tennessee River Near Prentiss | 145 cfs | → |
| Cartoogechaye Creek Near Franklin | 261 cfs | → |
| Little Tennessee R At Franklin | 1,050 cfs | → |
Make a day of it
Boat launches, lakeside camping, fishing access, and other reservoirs near Lake Toccoa Dam.
Boat launches
See all →


Campgrounds
See all →


Fishing spots
See all →


River runs
See all →


More reservoirs
See all →
About Lake Toccoa Dam
Where does the data for Lake Toccoa Dam come from?
Structural and regulatory data come from the U.S. Army Corps of Engineers' National Inventory of Dams (NID). Weather forecast comes from NOAA / yr.no -- the same feed Snoflo's iOS app uses.
How often is the report updated?
NID structural data refreshes annually as the Corps publishes updated assessments. The weather forecast refreshes throughout the day.
What does the High hazard rating mean?
The Corps of Engineers' hazard potential classification grades probable consequences if the dam fails: High = probable loss of human life; Significant = no probable loss of human life but possible economic loss / environmental damage; Low = no probable loss of human life, only minor economic / environmental losses. See the Dam Data Reference card below for the full definitions.
What's "% of normal"?
The current storage value compared to the historical average storage on this calendar day. 100% = right on average; values above 100% mean above-normal storage (wet year); values below mean below-normal (dry year or drought).
Can I get alerts when storage crosses a threshold?
Yes -- alerts are managed in the Snoflo iOS app. Favorite this dam, set a threshold, and you'll get a push the moment conditions cross.
Dam data reference
Condition Assessment
- Satisfactory
- No existing or potential dam safety deficiencies are recognized. Acceptable performance is expected under all loading conditions (static, hydrologic, seismic) in accordance with the minimum applicable state or federal regulatory criteria or tolerable risk guidelines.
- Fair
- No existing dam safety deficiencies are recognized for normal operating conditions. Rare or extreme hydrologic and/or seismic events may result in a dam safety deficiency. Risk may be in the range to take further action.
- Poor
- A dam safety deficiency is recognized for normal operating conditions which may realistically occur. Remedial action is necessary. POOR may also be used when uncertainties exist as to critical analysis parameters which identify a potential dam safety deficiency.
- Unsatisfactory
- A dam safety deficiency is recognized that requires immediate or emergency remedial action for problem resolution.
- Not Rated
- The dam has not been inspected, is not under state or federal jurisdiction, or has been inspected but, for whatever reason, has not been rated.
Hazard Potential Classification
- High
- Dams assigned the high hazard potential classification are those where failure or mis-operation will probably cause loss of human life.
- Significant
- Dams assigned the significant hazard potential classification are those dams where failure or mis-operation results in no probable loss of human life but can cause economic loss, environmental damage, disruption of lifeline facilities, or impact other concerns. Significant hazard potential classification dams are often located in predominantly rural or agricultural areas but could be in areas with population and significant infrastructure.
- Low
- Dams assigned the low hazard potential classification are those where failure or mis-operation results in no probable loss of human life and low economic and/or environmental losses. Losses are principally limited to the owner's property.
- Undetermined
- Dams for which a downstream hazard potential has not been designated or is not provided.