Jones Pond Dam Dam

Jones Pond Dam
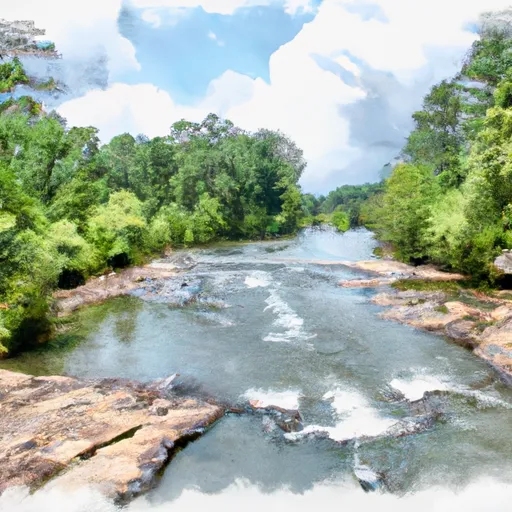
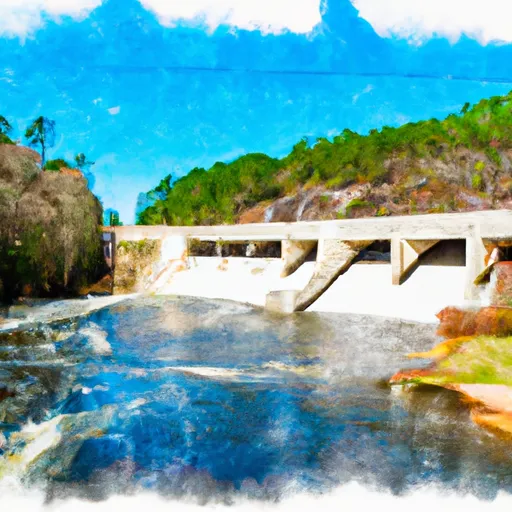
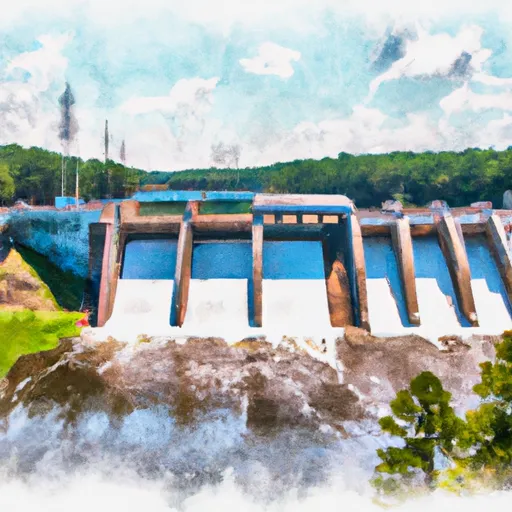
Jones Pond Dam, located in Wilkinson, Georgia, is a private-owned structure built in 1955 primarily for recreational purposes. The earth dam stands at a height of 17 feet and has a hydraulic height of 11 feet, with a length of 520 feet and a storage capacity of 72 acre-feet. Situated on TR-Black Creek in the EADY POND ENVIRONS, the dam's low hazard potential and moderate risk assessment make it a focal point for water resource and climate enthusiasts interested in sustainable water management practices.
Despite not being state-regulated or inspected, Jones Pond Dam serves as a vital recreational asset, offering a surface area of 8 acres for outdoor activities. The dam's uncontrolled spillway and outlet gates contribute to its unique design, while the lack of a designated condition assessment underscores the need for continued monitoring and maintenance. With its historical significance and strategic location within the Savannah District, Jones Pond Dam presents an opportunity for collaboration between private owners and federal agencies to enhance its resilience to climate change impacts and ensure its long-term sustainability for future generations.
As climate change poses increasing challenges to water resources, the significance of structures like Jones Pond Dam cannot be understated. Its proximity to the Black Creek and its role in providing recreational opportunities underscore the importance of integrating climate-resilient practices into dam management. With a focus on risk management, emergency preparedness, and adherence to guidelines, Jones Pond Dam serves as a case study for balancing recreational benefits with environmental stewardship in the face of a changing climate.
Plan around the weather
Same NOAA / yr.no feed Snoflo's iOS app uses. Watch the precipitation column on the meteogram -- rain on the basin upstream typically lifts inflow 24-72 hours later.
Next 5 days, hour by hour
Temperature line with weather symbols on top, snow + rain accumulation as columns, humidity as a dotted line.
5-day forecast table
Every 3 hours, broken out across temperature, snow, rain, humidity, and wind. Each cell is colour-coded relative to the column min/max.
| Time | Condition | Temp (°F) | Snow (in) | Rain (in) | Humidity (%) | Wind (mps) | Wind dir |
|---|---|---|---|---|---|---|---|
| Loading detailed forecast… | |||||||
15-day temperature & precipitation
Daily temperatures, snow, and rain projected over the next two weeks.
Nearby streamflow gauges
USGS streamgauges around Jones Pond Dam -- inflows here typically show up in storage 24-72 hours later.
| Streamgauge | Discharge | View |
|---|---|---|
| Oconee River At Milledgeville | 731 cfs | → |
| Oconee River At Avant Mine | 721 cfs | → |
| Buffalo Creek At Ga 272 | 27 cfs | → |
| Oconee River Near Oconee | 899 cfs | → |
| Murder Creek Below Eatonton | 50 cfs | → |
| Ocmulgee River At Macon | 1,650 cfs | → |


About Jones Pond Dam
Where does the data for Jones Pond Dam come from?
Structural and regulatory data come from the U.S. Army Corps of Engineers' National Inventory of Dams (NID). Weather forecast comes from NOAA / yr.no -- the same feed Snoflo's iOS app uses.
How often is the report updated?
NID structural data refreshes annually as the Corps publishes updated assessments. The weather forecast refreshes throughout the day.
What does the Low hazard rating mean?
The Corps of Engineers' hazard potential classification grades probable consequences if the dam fails: High = probable loss of human life; Significant = no probable loss of human life but possible economic loss / environmental damage; Low = no probable loss of human life, only minor economic / environmental losses. See the Dam Data Reference card below for the full definitions.
What's "% of normal"?
The current storage value compared to the historical average storage on this calendar day. 100% = right on average; values above 100% mean above-normal storage (wet year); values below mean below-normal (dry year or drought).
Can I get alerts when storage crosses a threshold?
Yes -- alerts are managed in the Snoflo iOS app. Favorite this dam, set a threshold, and you'll get a push the moment conditions cross.
Dam data reference
Condition Assessment
- Satisfactory
- No existing or potential dam safety deficiencies are recognized. Acceptable performance is expected under all loading conditions (static, hydrologic, seismic) in accordance with the minimum applicable state or federal regulatory criteria or tolerable risk guidelines.
- Fair
- No existing dam safety deficiencies are recognized for normal operating conditions. Rare or extreme hydrologic and/or seismic events may result in a dam safety deficiency. Risk may be in the range to take further action.
- Poor
- A dam safety deficiency is recognized for normal operating conditions which may realistically occur. Remedial action is necessary. POOR may also be used when uncertainties exist as to critical analysis parameters which identify a potential dam safety deficiency.
- Unsatisfactory
- A dam safety deficiency is recognized that requires immediate or emergency remedial action for problem resolution.
- Not Rated
- The dam has not been inspected, is not under state or federal jurisdiction, or has been inspected but, for whatever reason, has not been rated.
Hazard Potential Classification
- High
- Dams assigned the high hazard potential classification are those where failure or mis-operation will probably cause loss of human life.
- Significant
- Dams assigned the significant hazard potential classification are those dams where failure or mis-operation results in no probable loss of human life but can cause economic loss, environmental damage, disruption of lifeline facilities, or impact other concerns. Significant hazard potential classification dams are often located in predominantly rural or agricultural areas but could be in areas with population and significant infrastructure.
- Low
- Dams assigned the low hazard potential classification are those where failure or mis-operation results in no probable loss of human life and low economic and/or environmental losses. Losses are principally limited to the owner's property.
- Undetermined
- Dams for which a downstream hazard potential has not been designated or is not provided.