Donaldson Creek Frs No 8 Dam

Donaldson Creek Frs No 8
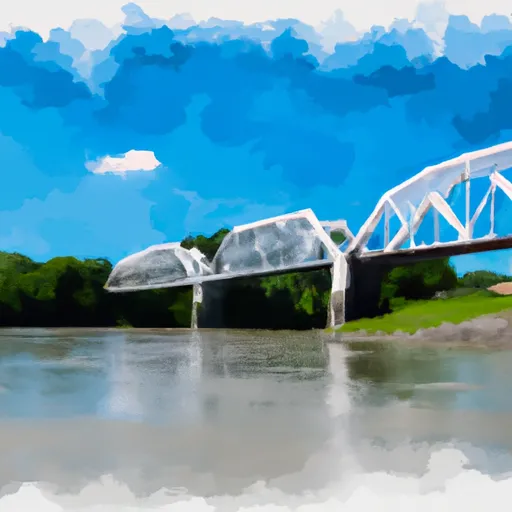
Donaldson Creek FRS No 8 is a critical flood risk reduction structure located in Caldwell, Kentucky, near the city of Creswell-Vicinity. Constructed in 1962 by the Soil Conservation Service, USDA NRCS, this Earth-type dam stands at a height of 24 feet and has a length of 970 feet, providing a storage capacity of 680 acre-feet to control the flow of Donaldson Creek. The dam serves the primary purpose of flood risk reduction, with a normal storage capacity of 53 acre-feet and a drainage area of 3.14 square miles.
Managed by the local government and regulated by the Kentucky Division of Water, Donaldson Creek FRS No 8 has a low hazard potential and a moderate risk assessment score of 3. Despite not being rated for its condition, the dam undergoes inspections every 5 years, with the last assessment conducted in March 2012. The structure is equipped with an uncontrolled spillway and has not undergone significant modifications since its completion.
For water resource and climate enthusiasts, Donaldson Creek FRS No 8 presents an intriguing case study in flood risk management and dam infrastructure in Kentucky. With its historical significance as a flood control measure and its role in protecting the surrounding area from potential inundation, this dam exemplifies the importance of proactive maintenance and monitoring to ensure the safety and efficacy of water management structures in the face of changing environmental conditions.
Plan around the weather
Same NOAA / yr.no feed Snoflo's iOS app uses. Watch the precipitation column on the meteogram -- rain on the basin upstream typically lifts inflow 24-72 hours later.
Next 5 days, hour by hour
Temperature line with weather symbols on top, snow + rain accumulation as columns, humidity as a dotted line.
5-day forecast table
Every 3 hours, broken out across temperature, snow, rain, humidity, and wind. Each cell is colour-coded relative to the column min/max.
| Time | Condition | Temp (°F) | Snow (in) | Rain (in) | Humidity (%) | Wind (mps) | Wind dir |
|---|---|---|---|---|---|---|---|
| Loading detailed forecast… | |||||||
15-day temperature & precipitation
Daily temperatures, snow, and rain projected over the next two weeks.
Nearby streamflow gauges
USGS streamgauges around Donaldson Creek Frs No 8 -- inflows here typically show up in storage 24-72 hours later.
| Streamgauge | Discharge | View |
|---|---|---|
| Tradewater River At Olney | 187 cfs | → |
| Little River Near Cadiz | 485 cfs | → |
| Ohio River At Old Shawneetown | 104,000 cfs | → |
| Pond River Near Apex | 853 cfs | → |
| Lusk Creek Near Eddyville | 5 cfs | → |
| Clarks River At Almo | 54 cfs | → |
Make a day of it
Boat launches, lakeside camping, fishing access, and other reservoirs near Donaldson Creek Frs No 8.
Boat launches
See all →


Campgrounds
See all →


Fishing spots
See all →


River runs
See all →


About Donaldson Creek Frs No 8
Where does the data for Donaldson Creek Frs No 8 come from?
Structural and regulatory data come from the U.S. Army Corps of Engineers' National Inventory of Dams (NID). Weather forecast comes from NOAA / yr.no -- the same feed Snoflo's iOS app uses.
How often is the report updated?
NID structural data refreshes annually as the Corps publishes updated assessments. The weather forecast refreshes throughout the day.
What does the Low hazard rating mean?
The Corps of Engineers' hazard potential classification grades probable consequences if the dam fails: High = probable loss of human life; Significant = no probable loss of human life but possible economic loss / environmental damage; Low = no probable loss of human life, only minor economic / environmental losses. See the Dam Data Reference card below for the full definitions.
What's "% of normal"?
The current storage value compared to the historical average storage on this calendar day. 100% = right on average; values above 100% mean above-normal storage (wet year); values below mean below-normal (dry year or drought).
Can I get alerts when storage crosses a threshold?
Yes -- alerts are managed in the Snoflo iOS app. Favorite this dam, set a threshold, and you'll get a push the moment conditions cross.
Dam data reference
Condition Assessment
- Satisfactory
- No existing or potential dam safety deficiencies are recognized. Acceptable performance is expected under all loading conditions (static, hydrologic, seismic) in accordance with the minimum applicable state or federal regulatory criteria or tolerable risk guidelines.
- Fair
- No existing dam safety deficiencies are recognized for normal operating conditions. Rare or extreme hydrologic and/or seismic events may result in a dam safety deficiency. Risk may be in the range to take further action.
- Poor
- A dam safety deficiency is recognized for normal operating conditions which may realistically occur. Remedial action is necessary. POOR may also be used when uncertainties exist as to critical analysis parameters which identify a potential dam safety deficiency.
- Unsatisfactory
- A dam safety deficiency is recognized that requires immediate or emergency remedial action for problem resolution.
- Not Rated
- The dam has not been inspected, is not under state or federal jurisdiction, or has been inspected but, for whatever reason, has not been rated.
Hazard Potential Classification
- High
- Dams assigned the high hazard potential classification are those where failure or mis-operation will probably cause loss of human life.
- Significant
- Dams assigned the significant hazard potential classification are those dams where failure or mis-operation results in no probable loss of human life but can cause economic loss, environmental damage, disruption of lifeline facilities, or impact other concerns. Significant hazard potential classification dams are often located in predominantly rural or agricultural areas but could be in areas with population and significant infrastructure.
- Low
- Dams assigned the low hazard potential classification are those where failure or mis-operation results in no probable loss of human life and low economic and/or environmental losses. Losses are principally limited to the owner's property.
- Undetermined
- Dams for which a downstream hazard potential has not been designated or is not provided.