Coffee Lake Dam

Coffee Lake
Coffee Lake in Carlton, Minnesota is a concrete gravity dam completed in 1939 with a primary purpose of recreation. Managed by the local government, this dam has a height of 10 feet and a storage capacity of 1500 acre-feet. The lake covers a surface area of 67 acres and has a drainage area of 11.6 square miles, with the Moose River serving as its primary water source.
The dam has a low hazard potential and is deemed to be in satisfactory condition as of the last inspection in July 2013. While it does not have an Emergency Action Plan (EAP) prepared, the risk assessment for the dam is moderate. The structure has a spillway type of uncontrolled and is located in the Detroit District under the jurisdiction of MNDNR EWR. With its serene setting and recreational opportunities, Coffee Lake is a valuable water resource for the community of Sturgeon Lake.
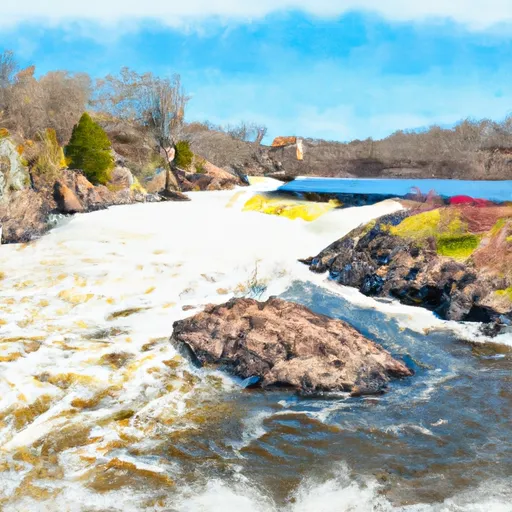
Enthusiasts of water resources and climate will appreciate the historical significance of the dam, designed by WPA-BC, and its role in providing recreational activities for the local residents. As a regulated structure in Minnesota, Coffee Lake serves as a vital part of the region's water management system, showcasing the intersection of human engineering and natural resources. Its location along the Moose River adds to its ecological importance, making it a focal point for conservation efforts and sustainable water use in the area.
Plan around the weather
Same NOAA / yr.no feed Snoflo's iOS app uses. Watch the precipitation column on the meteogram -- rain on the basin upstream typically lifts inflow 24-72 hours later.
Next 5 days, hour by hour
Temperature line with weather symbols on top, snow + rain accumulation as columns, humidity as a dotted line.
5-day forecast table
Every 3 hours, broken out across temperature, snow, rain, humidity, and wind. Each cell is colour-coded relative to the column min/max.
| Time | Condition | Temp (°F) | Snow (in) | Rain (in) | Humidity (%) | Wind (mps) | Wind dir |
|---|---|---|---|---|---|---|---|
| Loading detailed forecast… | |||||||
15-day temperature & precipitation
Daily temperatures, snow, and rain projected over the next two weeks.
Nearby streamflow gauges
USGS streamgauges around Coffee Lake -- inflows here typically show up in storage 24-72 hours later.
| Streamgauge | Discharge | View |
|---|---|---|
| Kettle River Below Sandstone | 98 cfs | → |
| St. Louis River At Scanlon | 658 cfs | → |
| St. Croix River Near Danbury | 541 cfs | → |
| Nemadji River Near South Superior | 45 cfs | → |
| Snake River Near Pine City | 129 cfs | → |
| Mississippi River At Aitkin | 545 cfs | → |
Make a day of it
Boat launches, lakeside camping, fishing access, and other reservoirs near Coffee Lake.
Boat launches
See all →


Campgrounds
See all →


Fishing spots
See all →


River runs
See all →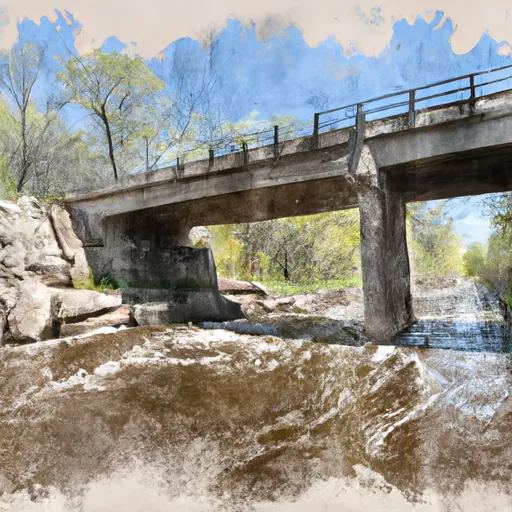

About Coffee Lake
Where does the data for Coffee Lake come from?
Structural and regulatory data come from the U.S. Army Corps of Engineers' National Inventory of Dams (NID). Weather forecast comes from NOAA / yr.no -- the same feed Snoflo's iOS app uses.
How often is the report updated?
NID structural data refreshes annually as the Corps publishes updated assessments. The weather forecast refreshes throughout the day.
What does the Low hazard rating mean?
The Corps of Engineers' hazard potential classification grades probable consequences if the dam fails: High = probable loss of human life; Significant = no probable loss of human life but possible economic loss / environmental damage; Low = no probable loss of human life, only minor economic / environmental losses. See the Dam Data Reference card below for the full definitions.
What's "% of normal"?
The current storage value compared to the historical average storage on this calendar day. 100% = right on average; values above 100% mean above-normal storage (wet year); values below mean below-normal (dry year or drought).
Can I get alerts when storage crosses a threshold?
Yes -- alerts are managed in the Snoflo iOS app. Favorite this dam, set a threshold, and you'll get a push the moment conditions cross.
Dam data reference
Condition Assessment
- Satisfactory
- No existing or potential dam safety deficiencies are recognized. Acceptable performance is expected under all loading conditions (static, hydrologic, seismic) in accordance with the minimum applicable state or federal regulatory criteria or tolerable risk guidelines.
- Fair
- No existing dam safety deficiencies are recognized for normal operating conditions. Rare or extreme hydrologic and/or seismic events may result in a dam safety deficiency. Risk may be in the range to take further action.
- Poor
- A dam safety deficiency is recognized for normal operating conditions which may realistically occur. Remedial action is necessary. POOR may also be used when uncertainties exist as to critical analysis parameters which identify a potential dam safety deficiency.
- Unsatisfactory
- A dam safety deficiency is recognized that requires immediate or emergency remedial action for problem resolution.
- Not Rated
- The dam has not been inspected, is not under state or federal jurisdiction, or has been inspected but, for whatever reason, has not been rated.
Hazard Potential Classification
- High
- Dams assigned the high hazard potential classification are those where failure or mis-operation will probably cause loss of human life.
- Significant
- Dams assigned the significant hazard potential classification are those dams where failure or mis-operation results in no probable loss of human life but can cause economic loss, environmental damage, disruption of lifeline facilities, or impact other concerns. Significant hazard potential classification dams are often located in predominantly rural or agricultural areas but could be in areas with population and significant infrastructure.
- Low
- Dams assigned the low hazard potential classification are those where failure or mis-operation results in no probable loss of human life and low economic and/or environmental losses. Losses are principally limited to the owner's property.
- Undetermined
- Dams for which a downstream hazard potential has not been designated or is not provided.