The Falls Dam dam

The Falls Dam
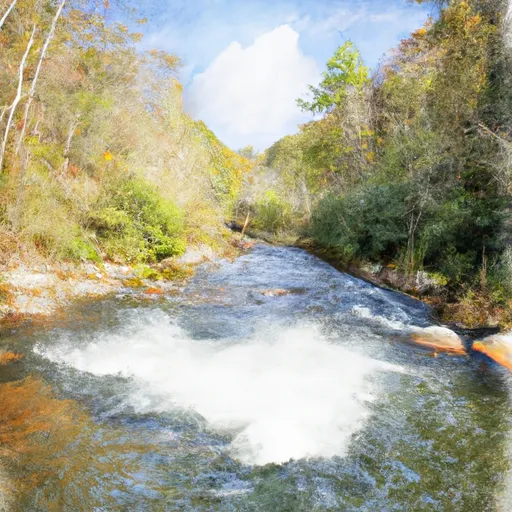
The Falls Dam, also known as Indian Creek Dam, is a private concrete structure located in Transylvania County, North Carolina. Completed in 1989, this dam primarily serves recreational purposes along the Indian Creek river. With a hydraulic height of 16 feet and a structural height of 25 feet, the dam stands at 164 feet in length and has a storage capacity of 77 acre-feet. Despite its low hazard potential, the dam is regulated and inspected by the North Carolina Department of Environmental Quality's Dam Safety Program to ensure its safety and compliance with state regulations.
Situated in Seneca Sc, the Falls Dam offers a serene setting for water resource and climate enthusiasts to enjoy various recreational activities such as boating, fishing, and wildlife watching. The dam's normal storage capacity of 32 acre-feet provides ample opportunities for outdoor enthusiasts to engage in water-based adventures. Managed by private owners, the Falls Dam is a picturesque spot where visitors can appreciate the beauty of nature while engaging in environmentally friendly recreational pursuits.
Although last inspected in 2010 and currently rated as "Not Rated" in terms of condition assessment, the Falls Dam remains a popular destination for locals and tourists alike. With its tranquil surroundings and diverse wildlife, this private dam on Indian Creek exemplifies the harmonious coexistence of human recreation and natural conservation. As climate change continues to impact water resources, the Falls Dam stands as a testament to the importance of sustainable management practices in preserving and protecting our waterways for future generations.
Plan around the weather
Same NOAA / yr.no feed Snoflo's iOS app uses. Watch the precipitation column on the meteogram -- rain on the basin upstream typically lifts inflow 24-72 hours later.
Next 5 days, hour by hour
Temperature line with weather symbols on top, snow + rain accumulation as columns, humidity as a dotted line.
5-day forecast table
Every 3 hours, broken out across temperature, snow, rain, humidity, and wind. Each cell is colour-coded relative to the column min/max.
| Time | Condition | Temp (°F) | Snow (in) | Rain (in) | Humidity (%) | Wind (mps) | Wind dir |
|---|---|---|---|---|---|---|---|
| Loading detailed forecast… | |||||||
15-day temperature & precipitation
Daily temperatures, snow, and rain projected over the next two weeks.
Nearby streamflow gauges
USGS streamgauges around The Falls Dam -- inflows here typically show up in storage 24-72 hours later.
| Streamgauge | Discharge | View |
|---|---|---|
| French Broad River At Rosman | 153 cfs | → |
| South Saluda River Near Cleveland | 5 cfs | → |
| Davidson River Near Brevard | 80 cfs | → |
| Tuckasegee River At Sr 1172 Nr Cullowhee | 743 cfs | → |
| W F Pigeon R Above Lake Logan Nr Hazelwood | 53 cfs | → |
| French Broad River At Blantyre | 502 cfs | → |
Make a day of it
Boat launches, lakeside camping, fishing access, and other reservoirs near The Falls Dam.
Boat launches
See all →


Campgrounds
See all →


Fishing spots
See all →


River runs
See all →


More reservoirs
See all →
About The Falls Dam
Where does the data for The Falls Dam come from?
Structural and regulatory data come from the U.S. Army Corps of Engineers' National Inventory of Dams (NID). Weather forecast comes from NOAA / yr.no -- the same feed Snoflo's iOS app uses.
How often is the report updated?
NID structural data refreshes annually as the Corps publishes updated assessments. The weather forecast refreshes throughout the day.
What does the Low hazard rating mean?
The Corps of Engineers' hazard potential classification grades probable consequences if the dam fails: High = probable loss of human life; Significant = no probable loss of human life but possible economic loss / environmental damage; Low = no probable loss of human life, only minor economic / environmental losses. See the Dam Data Reference card below for the full definitions.
What's "% of normal"?
The current storage value compared to the historical average storage on this calendar day. 100% = right on average; values above 100% mean above-normal storage (wet year); values below mean below-normal (dry year or drought).
Can I get alerts when storage crosses a threshold?
Yes -- alerts are managed in the Snoflo iOS app. Favorite this dam, set a threshold, and you'll get a push the moment conditions cross.
Dam data reference
Condition Assessment
- Satisfactory
- No existing or potential dam safety deficiencies are recognized. Acceptable performance is expected under all loading conditions (static, hydrologic, seismic) in accordance with the minimum applicable state or federal regulatory criteria or tolerable risk guidelines.
- Fair
- No existing dam safety deficiencies are recognized for normal operating conditions. Rare or extreme hydrologic and/or seismic events may result in a dam safety deficiency. Risk may be in the range to take further action.
- Poor
- A dam safety deficiency is recognized for normal operating conditions which may realistically occur. Remedial action is necessary. POOR may also be used when uncertainties exist as to critical analysis parameters which identify a potential dam safety deficiency.
- Unsatisfactory
- A dam safety deficiency is recognized that requires immediate or emergency remedial action for problem resolution.
- Not Rated
- The dam has not been inspected, is not under state or federal jurisdiction, or has been inspected but, for whatever reason, has not been rated.
Hazard Potential Classification
- High
- Dams assigned the high hazard potential classification are those where failure or mis-operation will probably cause loss of human life.
- Significant
- Dams assigned the significant hazard potential classification are those dams where failure or mis-operation results in no probable loss of human life but can cause economic loss, environmental damage, disruption of lifeline facilities, or impact other concerns. Significant hazard potential classification dams are often located in predominantly rural or agricultural areas but could be in areas with population and significant infrastructure.
- Low
- Dams assigned the low hazard potential classification are those where failure or mis-operation results in no probable loss of human life and low economic and/or environmental losses. Losses are principally limited to the owner's property.
- Undetermined
- Dams for which a downstream hazard potential has not been designated or is not provided.