W.d. Mayo Lock And Dam

W.D. Mayo Lock And Dam
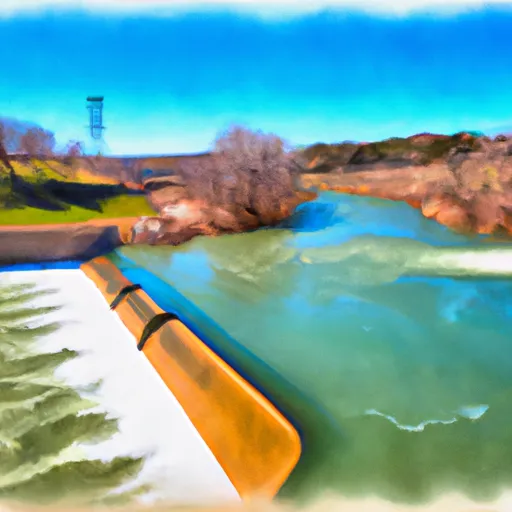
W.D. Mayo Lock and Dam, located in Sequoyah, Oklahoma, along the Arkansas River, was completed in 1970 by the US Army Corps of Engineers for the primary purpose of navigation. This gravity dam stands at a height of 71 feet and has a length of 7400 feet, with a storage capacity of 15,800 acre-feet. The dam is equipped with a controlled spillway and a single lock that is 600 feet long and 110 feet wide, facilitating the passage of vessels through the waterway.
Despite being classified as having a significant hazard potential, the risk assessment conducted in 2015 by the USACE identified potential failure scenarios related to lock structures and gates. To manage and reduce these risks, the USACE has implemented various measures, including the design and construction of a new system for maintenance dewatering and repairs. Additionally, emergency exercises, routine updates to the Emergency Action Plan, detailed inspections, and close coordination with the navigation industry are part of the ongoing risk management efforts. Instrumentation and monitoring systems are also in place to assess changing conditions and ensure the dam's integrity.
In the event of a failure, while downstream flooding is not expected due to the dam's design for navigation purposes, the economic impacts and disruption to navigation traffic would be significant. The proactive risk management approach undertaken by the USACE aims to mitigate these potential consequences and ensure the continued safe operation of W.D. Mayo Lock and Dam for both water resource management and climate resilience.
Plan around the weather
Same NOAA / yr.no feed Snoflo's iOS app uses. Watch the precipitation column on the meteogram -- rain on the basin upstream typically lifts inflow 24-72 hours later.
Next 5 days, hour by hour
Temperature line with weather symbols on top, snow + rain accumulation as columns, humidity as a dotted line.
5-day forecast table
Every 3 hours, broken out across temperature, snow, rain, humidity, and wind. Each cell is colour-coded relative to the column min/max.
| Time | Condition | Temp (°F) | Snow (in) | Rain (in) | Humidity (%) | Wind (mps) | Wind dir |
|---|---|---|---|---|---|---|---|
| Loading detailed forecast… | |||||||
15-day temperature & precipitation
Daily temperatures, snow, and rain projected over the next two weeks.
Nearby streamflow gauges
USGS streamgauges around W.D. Mayo Lock And Dam -- inflows here typically show up in storage 24-72 hours later.
| Streamgauge | Discharge | View |
|---|---|---|
| Arkansas River At Ft. Smith | 20,800 cfs | → |
| Poteau River Near Panama | 101 cfs | → |
| James Fork Near Hackett | 5 cfs | → |
| Lee Creek Near Short | 124 cfs | → |
| Lee Creek At Short | 99 cfs | → |
| Little Lee Creek Near Short | 1 cfs | → |


About W.D. Mayo Lock And Dam
Where does the data for W.d. Mayo Lock And Dam come from?
Structural and regulatory data come from the U.S. Army Corps of Engineers' National Inventory of Dams (NID). Weather forecast comes from NOAA / yr.no -- the same feed Snoflo's iOS app uses.
How often is the report updated?
NID structural data refreshes annually as the Corps publishes updated assessments. The weather forecast refreshes throughout the day.
What does the Significant hazard rating mean?
The Corps of Engineers' hazard potential classification grades probable consequences if the dam fails: High = probable loss of human life; Significant = no probable loss of human life but possible economic loss / environmental damage; Low = no probable loss of human life, only minor economic / environmental losses. See the Dam Data Reference card below for the full definitions.
What's "% of normal"?
The current storage value compared to the historical average storage on this calendar day. 100% = right on average; values above 100% mean above-normal storage (wet year); values below mean below-normal (dry year or drought).
Can I get alerts when storage crosses a threshold?
Yes -- alerts are managed in the Snoflo iOS app. Favorite this dam, set a threshold, and you'll get a push the moment conditions cross.
Dam data reference
Condition Assessment
- Satisfactory
- No existing or potential dam safety deficiencies are recognized. Acceptable performance is expected under all loading conditions (static, hydrologic, seismic) in accordance with the minimum applicable state or federal regulatory criteria or tolerable risk guidelines.
- Fair
- No existing dam safety deficiencies are recognized for normal operating conditions. Rare or extreme hydrologic and/or seismic events may result in a dam safety deficiency. Risk may be in the range to take further action.
- Poor
- A dam safety deficiency is recognized for normal operating conditions which may realistically occur. Remedial action is necessary. POOR may also be used when uncertainties exist as to critical analysis parameters which identify a potential dam safety deficiency.
- Unsatisfactory
- A dam safety deficiency is recognized that requires immediate or emergency remedial action for problem resolution.
- Not Rated
- The dam has not been inspected, is not under state or federal jurisdiction, or has been inspected but, for whatever reason, has not been rated.
Hazard Potential Classification
- High
- Dams assigned the high hazard potential classification are those where failure or mis-operation will probably cause loss of human life.
- Significant
- Dams assigned the significant hazard potential classification are those dams where failure or mis-operation results in no probable loss of human life but can cause economic loss, environmental damage, disruption of lifeline facilities, or impact other concerns. Significant hazard potential classification dams are often located in predominantly rural or agricultural areas but could be in areas with population and significant infrastructure.
- Low
- Dams assigned the low hazard potential classification are those where failure or mis-operation results in no probable loss of human life and low economic and/or environmental losses. Losses are principally limited to the owner's property.
- Undetermined
- Dams for which a downstream hazard potential has not been designated or is not provided.